empty
02.10.2023 10:49 AM
Weekly forecast based on simplified wave analysis for GBP/USD, AUD/USD, USD/CHF, EUR/JPY, and US dollar index from October 2nd

GBP/USD

Brief Analysis:

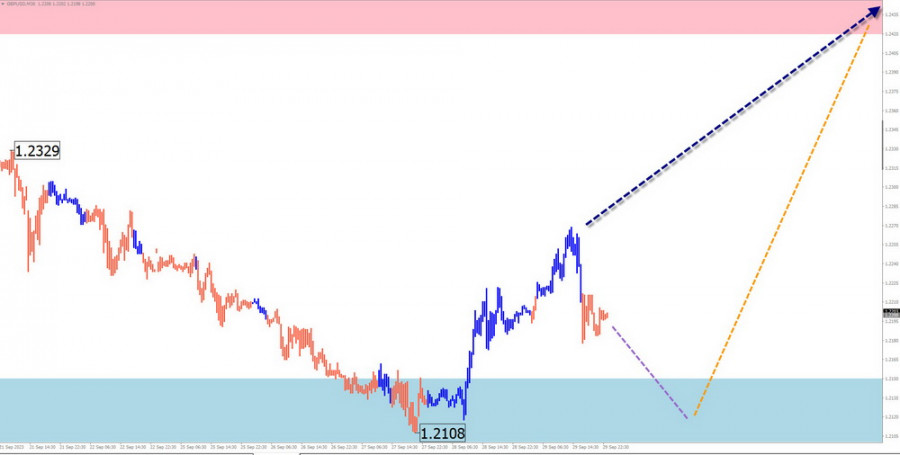
The major of the British pound has been pushing the pair's quotes down on the price chart since mid-July. The price has reached the upper boundary of a potentially reversal zone. Last week, a corrective phase began to form on the chart, which has not yet been completed.

Weekly Forecast:

At the beginning of the upcoming week, there is likely to be a repeat decline in the price of the British currency to the calculated support levels. Afterwards, we can expect a reversal to form. By the end of the week, we can anticipate the beginning of an upward price movement. The resistance zone represents the maximum expected upper boundary of the weekly range for the pair.

This image is no longer relevant

Potential Reversal Zones

Resistance:

  • 1.2420/1.2470

Support:

  • 1.2150/1.2100

Recommendations

Selling: Can be used within individual sessions with a reduced lot size. The downside potential is limited by the support zone.

Buying: Will become relevant after the appearance of corresponding signals from your trading systems in the support zone.

AUD/USD

Brief Analysis:

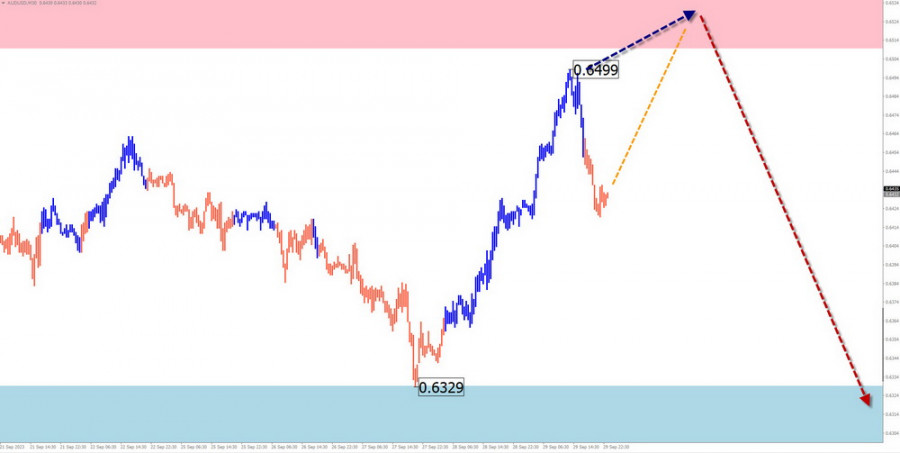
A descending trend dominates the market for the major Australian dollar pair. The count has been underway since July 14th. The price has closely approached the upper boundary of a potentially reversal zone over a large time frame. Over the past two months, the price has formed a correction along this boundary in the form of a stretched flat. The structure of the entire wave is nearing completion.

Weekly Forecast:

In the upcoming week, we expect the continuation of the Aussie's price movement within the corridor between the nearest zones of opposing directions. After potential pressure on the resistance zone at the beginning of the week, we can expect a reversal and a price rollback to the support zone. When the direction changes, a brief breach of the upper boundary of the zone is not excluded.

This image is no longer relevant

Potential Reversal Zones

Resistance:

  • 0.6510/0.6560

Support:

  • 0.6330/0.6280

Recommendations

Selling: Will be possible after the appearance of confirmed signals in the support zone.

Buying: Can be used with a reduced lot size within intraday trading. The resistance places a limit on the potential.

USD/CHF

Brief Analysis:

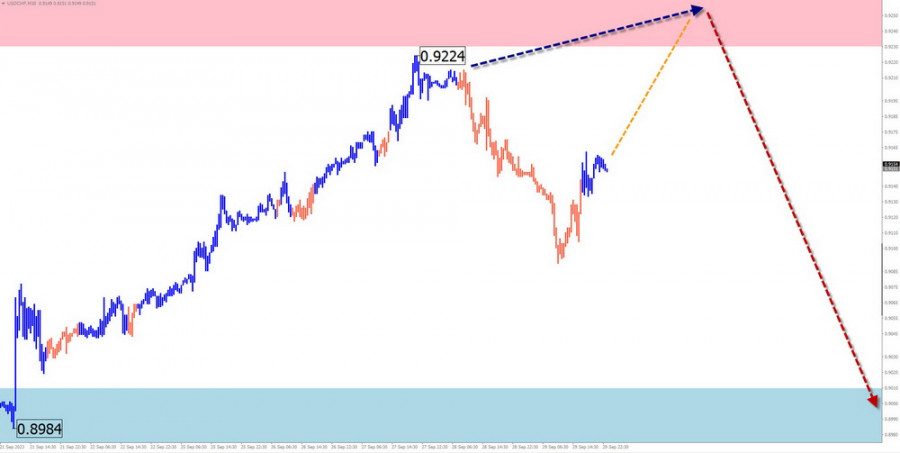
On the chart of the major Swiss franc pair, the ascending wave that started in mid-July continues to dominate. The quotes have come close to the lower boundary of a powerful reversal zone on a monthly scale chart. However, the wave structure does not indicate completion. There are no signals of an imminent change in course as of yet.

Weekly Forecast:

After a likely attempt to exert pressure on the resistance zone in the coming days, the pair's price is expected to move mainly sideways. With a high probability, we can then expect a reversal and the beginning of a price decline. When the course changes, a brief breach of the upper boundary of the resistance zone is not excluded.

This image is no longer relevant

Potential Reversal Zones

Resistance:

  • 0.9230/0.9280

Support:

  • 0.9010/0.8960

Recommendations

Buying: Due to the limited potential, there is a high probability of deposit loss.

Selling: Fractional lots can be used after the appearance of corresponding signals from your trading systems in the resistance zone.

EUR/JPY

Brief Analysis:

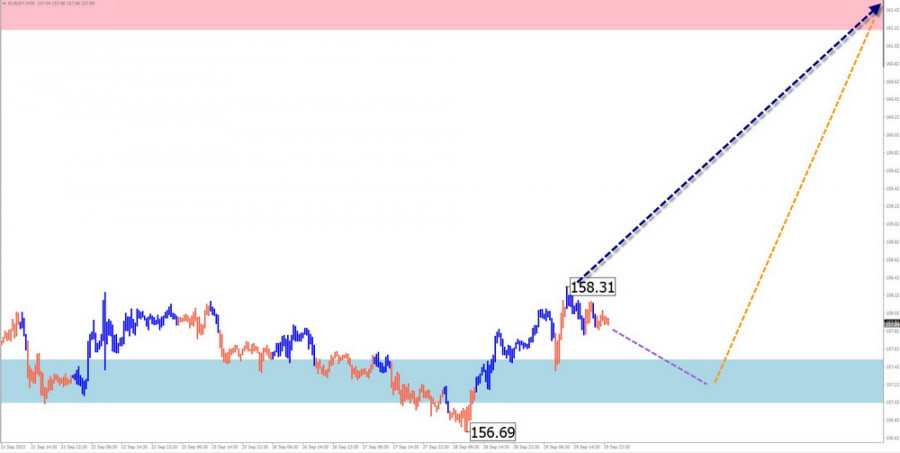
As of the analysis moment, the ascending wave pattern for the euro/yen chart started on July 28th. Over the past month and a half, a flat correction has been developing within it on a horizontal plane. The wave is not yet complete at the time of analysis. After the full completion of the retracement, the bullish trend of the pair will continue.

Weekly Forecast:

At the beginning of the upcoming week, the pair's price is expected to move sideways along the boundaries of the support zone. By the end of the week, a reversal and the resumption of the price ascent can be expected.

This image is no longer relevant

Potential Reversal Zones

Resistance:

  • 161.20/161.70

Support:

  • 157.50/157.00

Recommendations

Selling: Possible within intraday trading with fractional lots. The potential for trade is limited by support.

Buying: After the appearance of confirmed reversal signals in the support zone, they may be recommended as the main direction for trading.

USDollar Index

Brief Analysis:

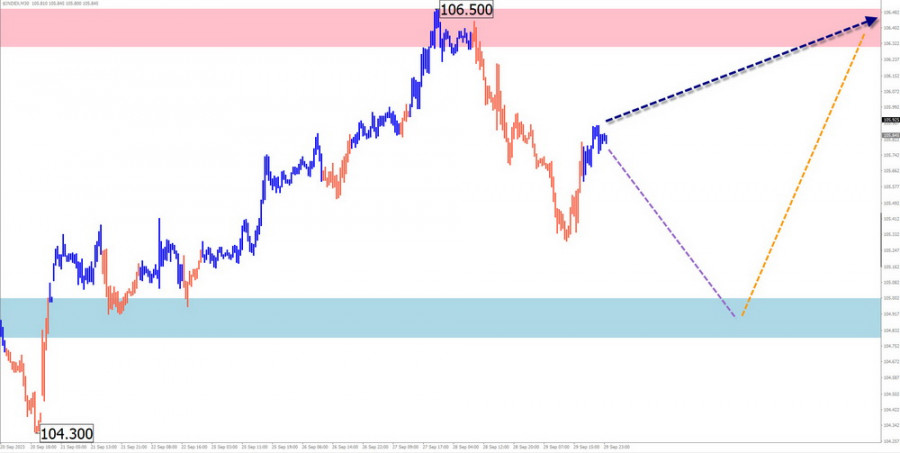
The short-term bullish trend of the US dollar, which started in mid-July, continues. The quotes have reached the lower boundary of a potentially reversal zone on the daily time frame. The wave structure does not indicate completion. At the end of the last week, a descending segment began to form.

Weekly Forecast:

In the first half of the upcoming week, a general sideways movement of the index is most likely. A downward vector is possible, with a decrease not below the support zone area. Afterward, the dollar's rate is expected to resume its ascent.

This image is no longer relevant

Potential Reversal Zones

Resistance:

  • 106.30/106.50

Support:

  • 105.00/104.80

Recommendations

Placing bets on the dollar's continued growth in the near future is risky and may lead to deposit losses. The optimal tactic will be to refrain from trading in major pairs until signals of the dollar's rate increase appear.

Notes: In simplified wave analysis (SWA), all waves consist of three parts (A, B, and C). In each time frame, the latest, unfinished wave is analyzed. Dashed lines indicate expected movements.

Attention: The wave algorithm does not take into account the duration of instrument movements in time!

เลือกช่วงเวลา
5
นาที
15
นาที
30
นาที
1
ชั่วโมง
4
ชั่วโมง
1
วัน
1
สัปดาห์
รับผลกำไรจากการเปลี่ยนแปลงอัตราสกุลเงินดิจิทัลกับ InstaForex.
ดาวน์โหลด MetaTrader 4 และเปิดการซื้อขายครั้งแรกของคุณ.
  • Grand Choice
    Contest by
    InstaForex
    InstaForex always strives to help you
    fulfill your biggest dreams.
    เข้าร่วมการแข่งขัน


บทความแนะนำ

การวิเคราะห์ EUR/USD ประจำวันที่ 9 พฤษภาคม 2025

โครงสร้างของคลื่นในกราฟ EUR/USD แบบ 4 ชั่วโมง ได้เปลี่ยนเป็นรูปแบบขาขึ้น ฉันเชื่อว่าแทบไม่มีข้อสงสัยใด ๆ เลยว่าการเปลี่ยนแปลงนี้เกิดจากนโยบายการค้าฉบับใหม่ของสหรัฐเท่านั้น จนถึงวันที่ 28 กุมภาพันธ์ เมื่อค่าเงินดอลลาร์สหรัฐเริ่มตกลงโครงสร้างคลื่นทั้งหมดชัดเจนว่าเป็นขาลง สิ่งที่กำลังเกิดขึ้นคือคลื่นปรับฐานที่

Chin Zhao 19:19 2025-05-09 UTC+2

การวิเคราะห์ GBP/USD ประจำวันที่ 9 พฤษภาคม 2025

รูปแบบคลื่นสำหรับเครื่องมือ GBP/USD ก็ได้เปลี่ยนไปสู่โครงสร้างขาขึ้นและเร่งตัวเช่นเดียวกัน—"ขอบคุณ" Donald Trump รูปแบบคลื่นเกือบจะเหมือนกับ EUR/USD จนถึงวันที่ 28 กุมภาพันธ์ เราได้สังเกตเห็นโครงสร้างแก้ไขโทนแต้ไม่มีข้อกังวล อย่างไรก็ตาม ความต้องการเงินดอลลาร์สหรัฐเริ่มลดลงอย่างรวดเร็วตามมา ผลที่ได้คือการสร้างโครงสร้างห้าคลื่นขาขึ้น คลื่นที่

Chin Zhao 19:16 2025-05-09 UTC+2

การวิเคราะห์ GBP/USD วันที่ 8 พฤษภาคม 2025

โครงสร้างคลื่นของ GBP/USD ได้เปลี่ยนไปเป็นรูปแบบขาขึ้นที่มีแรงกระตุ้นจาก "ความสำเร็จ" ของ Donald Trump ลักษณะคลื่นใกล้เคียงกับ EUR/USD เป็นอย่างมาก จนถึงวันที่ 28 กุมภาพันธ์ เราได้สังเกตเห็นการก่อตัวของโครงสร้างการแก้ไขที่ชัดเจนและไม่มีปัญหาใด

Chin Zhao 19:40 2025-05-08 UTC+2

การวิเคราะห์ EUR/USD วันที่ 8 พฤษภาคม 2025

รูปแบบคลื่นบนกราฟ 4 ชั่วโมงของ EUR/USD ได้เปลี่ยนแปลงมาเป็นโครงสร้างขาขึ้น ผมเชื่อว่าไม่มีข้อสงสัยว่านี่เป็นผลมาจากนโยบายการค้าใหม่ของสหรัฐฯ ก่อนวันที่ 28 กุมภาพันธ์ เมื่อค่าเงินดอลลาร์สหรัฐเริ่มมีการลดค่าอย่างรุนแรง โครงสร้างคลื่นทั้งหมดดูเหมือนเป็นแนวโน้มขาลงที่ชัดเจน ส่วนที่เป็นคลื่นปรับฐาน 2 กำลังถูกสร้างขึ้น อย่างไรก็ตาม

Chin Zhao 19:33 2025-05-08 UTC+2

วิเคราะห์ GBP/USD ประจำวันที่ 7 พฤษภาคม 2025

รูปแบบแนวโน้มของ GBP/USD ได้ปรับเปลี่ยนเป็นโครงสร้างขาขึ้นในลักษณะกระตุ้น—"ต้องขอบคุณ" Donald Trump รูปแบบนี้คล้ายคลึงกับ EUR/USD จนถึงวันที่ 28 กุมภาพันธ์ เราเห็นโครงสร้างการแก้ไขที่ดูน่าเชื่อถือ ซึ่งไม่ได้สร้างความกังวล อย่างไรก็ตาม ความต้องการเงินดอลลาร์สหรัฐเริ่มลดลงอย่างรวดเร็ว ส่งผลให้เกิดโครงสร้างขาขึ้นแบบห้าคลื่นขึ้น

Chin Zhao 19:55 2025-05-07 UTC+2

การวิเคราะห์ EUR/USD วันที่ 7 พฤษภาคม 2025

รูปแบบคลื่นในกราฟ 4 ชั่วโมงของ EUR/USD ได้เปลี่ยนเป็นโครงสร้างขาขึ้น ผมเชื่อว่าแทบไม่มีข้อสงสัยเลยว่าการเปลี่ยนแปลงนี้เกิดขึ้นโดยสิ้นเชิงเนื่องจากนโยบายการค้าของสหรัฐฯ ที่เปลี่ยนไป จนถึงวันที่ 28 กุมภาพันธ์ ซึ่งเป็นช่วงที่ค่าเงินดอลลาร์สหรัฐเริ่มตกต่ำลงอย่างรุนแรง โครงสร้างคลื่นทั้งหมดดูเหมือนเป็นช่วงแนวโน้มขาลงที่น่าเชื่อถือ โดยมีคลื่นแก้ไขที่ 2 กำลังเกิดขึ้น

Chin Zhao 19:51 2025-05-07 UTC+2

การวิเคราะห์ GBP/USD – 6 พฤษภาคม: เงินปอนด์เมินเฉยต่อ BoE

โครงสร้างการเคลื่อนที่ของคู่เงิน GBP/USD ก็ได้เปลี่ยนมาเป็นโครงสร้างลักษณะขาขึ้นตามแบบ impulse ด้วยความ "ขอบคุณ" จาก Donald Trump ภาพคลื่นแทบจะเหมือนกับของ EUR/USD ก่อนวันที่ 28 กุมภาพันธ์ เราได้สังเกตเห็นโครงสร้างการแก้ไขที่น่าเชื่อถือซึ่งไม่ได้ก่อให้เกิดความกังวลใหญ่ใด

Chin Zhao 19:06 2025-05-06 UTC+2

การวิเคราะห์ EUR/USD – 6 พฤษภาคม: ธนาคารกลางสหรัฐยึดแนวทางเข้มงวด

วิเคราะห์กราฟ EUR/USD รูปแบบคลื่นบนกราฟ EUR/USD ช่วง 4 ชั่วโมง ได้เปลี่ยนเป็นโครงสร้างที่มีแนวโน้มขาขึ้น ผมเชื่อว่าไม่มีข้อสงสัยเลยว่าการเปลี่ยนแปลงนี้เกิดขึ้นเนื่องจากนโยบายการค้าใหม่ที่ใช้โดยสหรัฐอเมริกาเพียงอย่างเดียว จนถึงวันที่ 28 กุมภาพันธ์—เมื่อการลดลงอย่างมากของสกุลเงินดอลลาร์สหรัฐฯ เริ่มขึ้น—รูปแบบคลื่นได้นำเสนอแนวโน้มขาลงที่น่าเชื่อถือ สร้างคลื่นแก้ไข

Chin Zhao 19:03 2025-05-06 UTC+2

การวิเคราะห์ GBP/USD – 5 พฤษภาคม ธนาคารแห่งประเทศอังกฤษเตรียมอะไรไว้สำหรับเราบ้าง?

โครงสร้างคลื่นสำหรับคู่สกุลเงิน GBP/USD ได้เปลี่ยนไปเป็นรูปแบบเคลื่อนตัวขึ้นแบบแรง — "ขอบคุณ" โดนัลด์ ทรัมป์ ภาพของคลื่นนั้นเกือบจะเหมือนกับคู่ EUR/USD จนถึงวันที่ 28 กุมภาพันธ์ เราสังเกตเห็นการสร้างโครงสร้างการแก้ไขที่น่าเชื่อถือ ซึ่งไม่มีปัญหาใด

Chin Zhao 18:09 2025-05-05 UTC+2

วิเคราะห์ EUR/USD – วันที่ 5 พฤษภาคม: ภาษีใหม่ของทรัมป์ล้มเหลวในการสร้างความประทับใจ

โครงสร้างคลื่นในแผนภูมิ 4 ชั่วโมงสำหรับคู่สกุลเงิน EUR/USD ได้เปลี่ยนเป็นแนวโน้มแบบกระทิง ฉันเชื่อว่าไม่มีข้อสงสัยว่าการเปลี่ยนแปลงนี้เป็นไปได้อย่างสมบูรณ์เนื่องจากนโยบายการค้าใหม่ของสหรัฐอเมริกา จนกระทั่งถึงวันที่ 28 กุมภาพันธ์ เมื่อสกุลเงินดอลลาร์สหรัฐเริ่มต้นการลดลงอย่างรวดเร็ว โครงสร้างคลื่นทั้งหมดดูเหมือนจะเป็นแนวโน้มขาลงที่น่าเชื่อถือโดยสร้างคลื่นแก้ไขที่ 2 แต่การประกาศอัตราภาษีต่าง ๆ อย่างถี่ถ้วนของทรัมป์ทุกสัปดาห์ได้มีผลกระทบอย่างมาก

Chin Zhao 18:06 2025-05-05 UTC+2
หากไม่สะดวกคุยในตอนนี้
ระบุคำถามไว้ได้ใน แชท.
Widget callback
 

Dear visitor,

Your IP address shows that you are currently located in the USA. If you are a resident of the United States, you are prohibited from using the services of InstaFintech Group including online trading, online transfers, deposit/withdrawal of funds, etc.

If you think you are seeing this message by mistake and your location is not the US, kindly proceed to the website. Otherwise, you must leave the website in order to comply with government restrictions.

Why does your IP address show your location as the USA?

  • - you are using a VPN provided by a hosting company based in the United States;
  • - your IP does not have proper WHOIS records;
  • - an error occurred in the WHOIS geolocation database.

Please confirm whether you are a US resident or not by clicking the relevant button below. If you choose the wrong option, being a US resident, you will not be able to open an account with InstaForex anyway.

We are sorry for any inconvenience caused by this message.