

сила сигнала 1 из 5
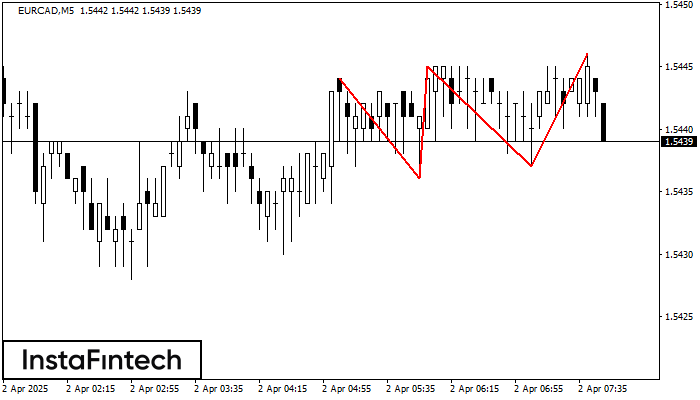
На графике EURCAD M5 образовалась фигура «Тройная вершина», которая сигнализирует об изменении тенденции. Возможный сценарий: После формирования третьей вершины котировка постарается пробить нижнюю границу 1.5437, где трейдеру и стоило бы открывать торговую позицию на продажу. Тейк Профит - это и есть проекция ширины фигуры, которая составляет 8 пунктов.
Таймфреймы М5 и М15 могут иметь больше ложных точек входа.
- Все
- Вымпел
- Голова и плечи
- Двойная вершина
- Прямоугольник
- Треугольник
- Тройная вершина
- Флаг
- Все
- #AAPL
- #AMZN
- #Bitcoin
- #EBAY
- #FB
- #GOOG
- #INTC
- #KO
- #MA
- #MCD
- #MSFT
- #NTDOY
- #PEP
- #TSLA
- #TWTR
- AUDCAD
- AUDCHF
- AUDJPY
- AUDUSD
- EURCAD
- EURCHF
- EURGBP
- EURJPY
- EURNZD
- EURRUB
- EURUSD
- GBPAUD
- GBPCHF
- GBPJPY
- GBPUSD
- GOLD
- NZDCAD
- NZDCHF
- NZDJPY
- NZDUSD
- SILVER
- USDCAD
- USDCHF
- USDJPY
- USDRUB
- Все
- M5
- M15
- M30
- H1
- D1
- Все
- Покупка
- Продажа
- Все
- 1
- 2
- 3
- 4
- 5
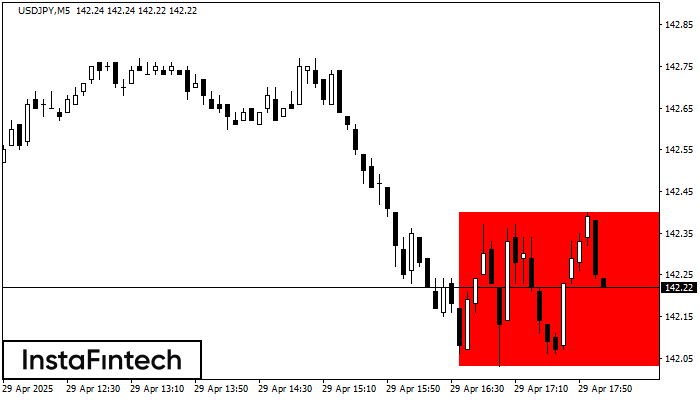
According to the chart of M5, USDJPY formed the Bearish Rectangle. This type of a pattern indicates a trend continuation. It consists of two levels: resistance 142.40 - 0.00
The M5 and M15 time frames may have more false entry points.
Open chart in a new window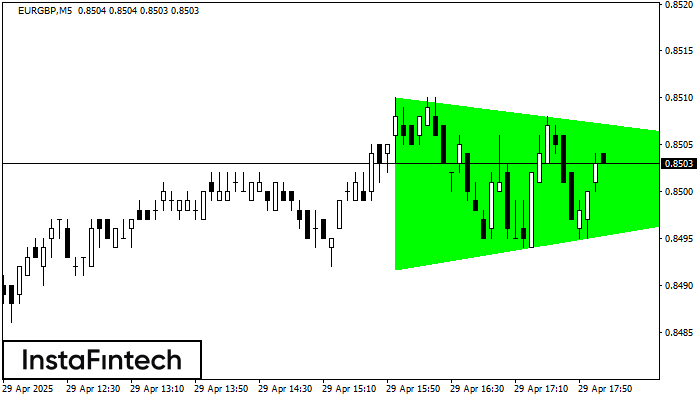
According to the chart of M5, EURGBP formed the Bullish Symmetrical Triangle pattern. Description: This is the pattern of a trend continuation. 0.8510 and 0.8492 are the coordinates
The M5 and M15 time frames may have more false entry points.
Open chart in a new window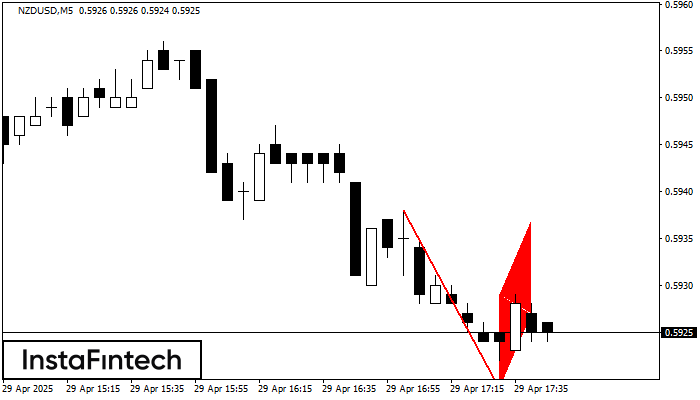
The Bearish Flag pattern has been formed on the chart NZDUSD M5. Therefore, the downwards trend is likely to continue in the nearest term. As soon as the price breaks
The M5 and M15 time frames may have more false entry points.
Open chart in a new window


