


signal strength 4 of 5
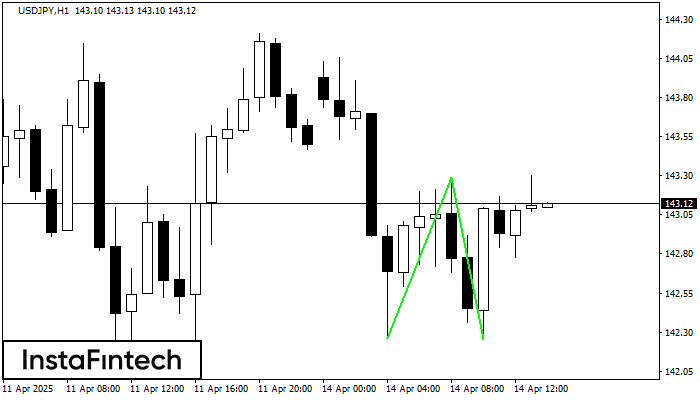
The Double Bottom pattern has been formed on USDJPY H1. Characteristics: the support level 142.26; the resistance level 143.29; the width of the pattern 103 points. If the resistance level is broken, a change in the trend can be predicted with the first target point lying at the distance of 104 points.
See Also
- All
- Double Top
- Flag
- Head and Shoulders
- Pennant
- Rectangle
- Triangle
- Triple top
- All
- #AAPL
- #AMZN
- #Bitcoin
- #EBAY
- #FB
- #GOOG
- #INTC
- #KO
- #MA
- #MCD
- #MSFT
- #NTDOY
- #PEP
- #TSLA
- #TWTR
- AUDCAD
- AUDCHF
- AUDJPY
- AUDUSD
- EURCAD
- EURCHF
- EURGBP
- EURJPY
- EURNZD
- EURRUB
- EURUSD
- GBPAUD
- GBPCHF
- GBPJPY
- GBPUSD
- GOLD
- NZDCAD
- NZDCHF
- NZDJPY
- NZDUSD
- SILVER
- USDCAD
- USDCHF
- USDJPY
- USDRUB
- All
- M5
- M15
- M30
- H1
- D1
- All
- Buy
- Sale
- All
- 1
- 2
- 3
- 4
- 5
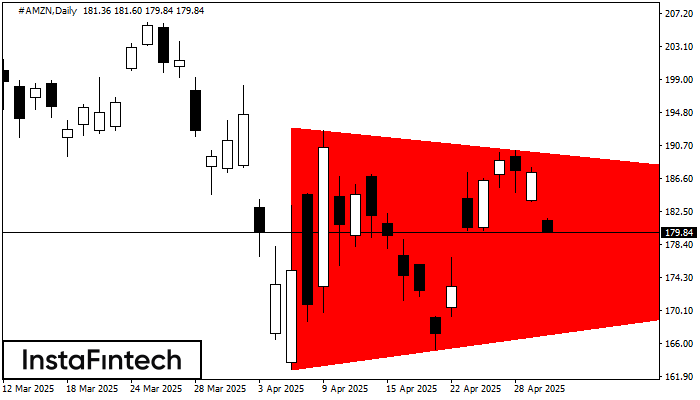
По #AMZN D1 сформировалась фигура «Медвежий симметричный треугольник». Данная фигура сигнализирует нам о продолжении нисходящего тренда в случае пробоя нижней границы 162.77, где вероятная прибыль будет являться шириной текущей фигуры
Открыть график инструмента в новом окне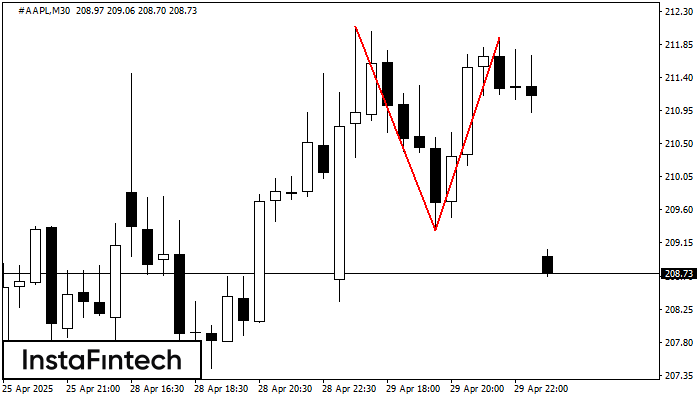
По торговому инструменту #AAPL на M30 сформировалась фигура «Двойная вершина», которая сигнализирует нам об изменении тенденции с восходящей на нисходящую. Вероятно, что, в случае пробоя основания фигуры 209.32, возможно дальнейшее
Открыть график инструмента в новом окне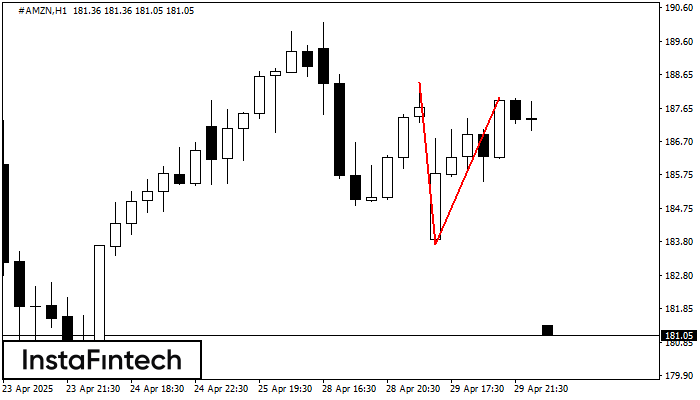
По #AMZN на H1 сформировалась разворотная фигура «Двойная вершина». Характеристика: Верхняя граница 188.42; Нижняя граница 183.71; Ширина фигуры 426 пунктов. Позицию на продажу возможно открыть ниже нижней границы 183.71
Открыть график инструмента в новом окне


