


signal strength 3 of 5

According to the chart of M30, GBPUSD formed the Bullish Symmetrical Triangle pattern. The lower border of the pattern touches the coordinates 1.2876/1.2915 whereas the upper border goes across 1.2971/1.2915. If the Bullish Symmetrical Triangle pattern is in progress, this evidently signals a further upward trend. In other words, in case the scenario comes true, the price of GBPUSD will breach the upper border to head for 1.2945.
- All
- Double Top
- Flag
- Head and Shoulders
- Pennant
- Rectangle
- Triangle
- Triple top
- All
- #AAPL
- #AMZN
- #Bitcoin
- #EBAY
- #FB
- #GOOG
- #INTC
- #KO
- #MA
- #MCD
- #MSFT
- #NTDOY
- #PEP
- #TSLA
- #TWTR
- AUDCAD
- AUDCHF
- AUDJPY
- AUDUSD
- EURCAD
- EURCHF
- EURGBP
- EURJPY
- EURNZD
- EURRUB
- EURUSD
- GBPAUD
- GBPCHF
- GBPJPY
- GBPUSD
- GOLD
- NZDCAD
- NZDCHF
- NZDJPY
- NZDUSD
- SILVER
- USDCAD
- USDCHF
- USDJPY
- USDRUB
- All
- M5
- M15
- M30
- H1
- D1
- All
- Buy
- Sale
- All
- 1
- 2
- 3
- 4
- 5

No gráfico de NZDCAD D1 o padrão de reversão Topo duplo foi formado. Características: o limite superior 0.8316; o limite inferior 0.7826; a largura do padrão 490 pontos. O sinal
Open chart in a new window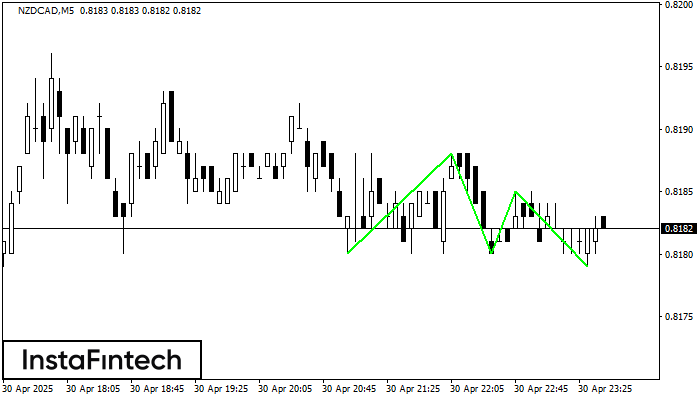
O padrão Fundo triplo foi formado em NZDCAD M5. Possui as seguintes características: nível de resistência 0.8188/0.8185; nível de suporte 0.8180/0.8179; a largura é de 8 pontos. Se houver
Os intervalos M5 e M15 podem ter mais pontos de entrada falsos.
Open chart in a new window
De acordo com o gráfico de M15, #Bitcoin formou o padrão de Triângulo Simétrico de Alta. O limite inferior do padrão toca as coordenadas 92482.78/94081.93 enquanto o limite superior cruza
Os intervalos M5 e M15 podem ter mais pontos de entrada falsos.
Open chart in a new window


