GBP/USD
Brief Analysis:
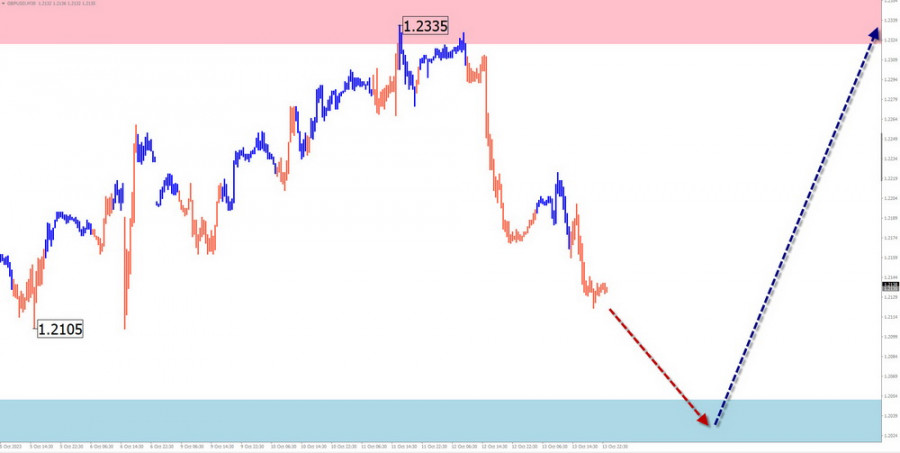
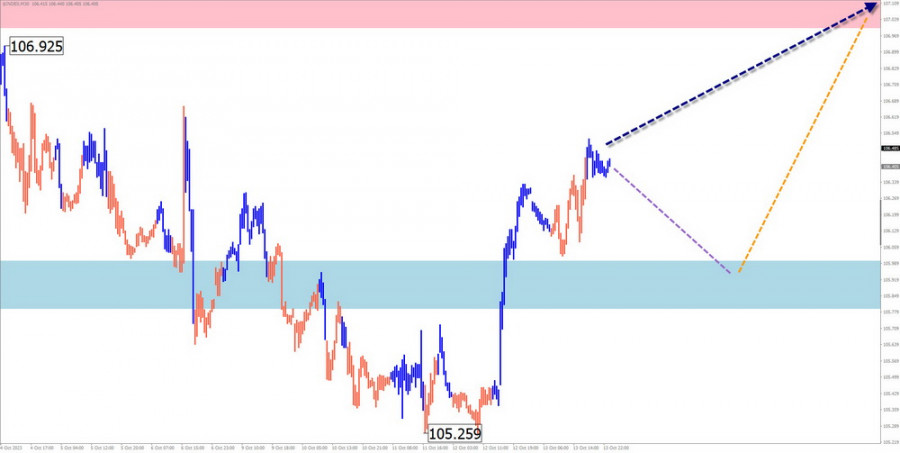
The current wave structure of the British pound chart, at the time of analysis, counts from mid-July. Its wave level has reached the upper boundary of a strong potential daily reversal zone. Over the last two weeks, quotes have formed a zigzag pattern in the form of a stretched horizontal plane. The corrective structure is unfinished at the time of analysis.
Weekly Forecast:
In the upcoming week, the price of the pair is expected to move within a range between the nearest opposing zones. A bearish vector is more likely at the beginning of the week. A price decline can be expected due to the calculated support. By the end of the week, there is an increased likelihood of a change in direction.
Potential Reversal Zones
Resistance:
Support:
Recommendations:
Purchases: The resistance zone has a limit. After the appearance of reversal signals in the resistance zone, purchases with a reduced volume within the intraday framework will become possible.
Sales: Possible within separate sessions with reduced volume.
AUD/USD
Brief Analysis:
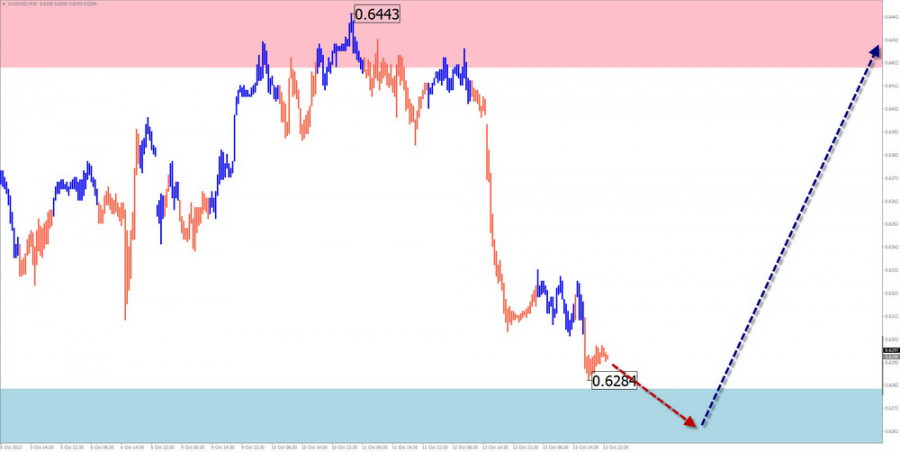
The Australian dollar market continues its southward movement on the price chart. The unfinished segment counts from mid-July. Within this segment, in the last decade, the price has formed a flat correction that is unfinished at the time of analysis. Quotes are near the lower boundary of strong resistance.
Weekly Forecast:
In the next couple of days, a sideways range is expected, in which conditions for a change in direction will be formed. The beginning of a decline is likely closer to the end of the week. It is unlikely that the price will move below the calculated support within the next week.
Potential Reversal Zones
Resistance:
Support:
Recommendations:
Purchases: will become relevant after the appearance of confirmed reversal signals in the resistance zone.
Sales: high-risk and not recommended.
USD/CHF
Brief Analysis:
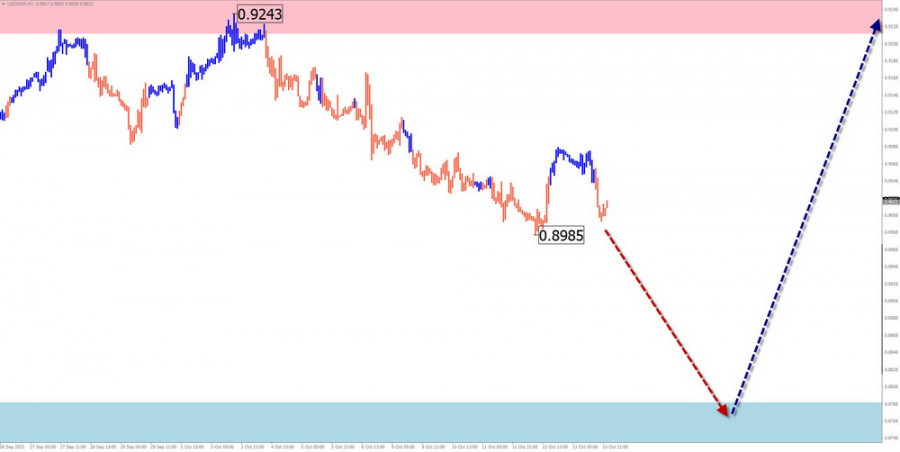
The current wave structure of the Swiss franc major chart is directed upward. It started on July 14th. On the larger daily chart, this segment became a correction. The price has reached the lower boundary of a strong resistance zone. In the past two weeks, the pair's quotes have been retracing downward from this level, forming a corrective flat.
Weekly Forecast:
At the beginning of the upcoming week, there is a high probability of continued decline, possibly down to the support zone. A brief breakthrough of its lower boundary is possible. Closer to the weekend, the likelihood of a reversal and a resumption of price growth increases.
Potential Reversal Zones
Resistance:
Support:
Recommendations
Sales: Can be used for short-term trading with a reduced lot size.
Purchases: will become possible after the appearance of reversal signals in the support area, according to your trading system (TS).
EUR/JPY
Brief Analysis:
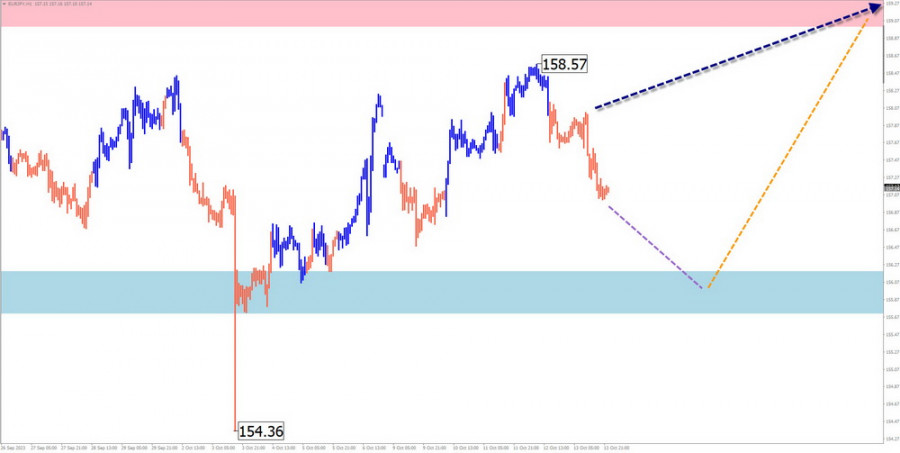
An ascending wave pattern has been controlling the price movement of the euro against the Japanese yen since late July of this year. In its structure, the middle part (B) has been forming for the last three months. During this time, the price has moved in a sideways pattern, forming a price corridor of approximately 3 price figures.
Weekly Forecast:
At the beginning of the upcoming week, the price of the pair is expected to experience a flat decline down to the calculated support level. Afterwards, you can expect a reversal and a resumption of price growth. The resistance zone shows the most likely upper boundary of the pair's weekly movement.
Potential Reversal Zones
Resistance:
Support:
Recommendations
Sales: Possible with a reduced lot size within a separate session. The support zone limits the potential for a decline.
Purchases: will become relevant after the appearance of confirmed reversal signals in the support area.
US Dollar Index
Brief Analysis:
As a result of a three-month bullish trend, the dollar quotes are approaching the lower boundary of a powerful potential reversal zone. The unfinished segment of the main course started on October 4th. In its structure, the middle part of the wave (B) is forming in the form of a stretched flat.
Weekly Forecast:
Throughout the upcoming week, the dollar is expected to move within a price range between opposing zones. At the beginning of the week, a downward vector is more likely. A change in direction can be expected closer to the weekend. A breakthrough in the calculated zones within the week is unlikely.
Potential Reversal Zones
Resistance:
Support:
Recommendations
Purchases: Short-term deals for strengthening positions in national currencies in major pairs may be possible.
Sales: This will be recommended for national currencies after the strengthening begins in the support zone of the US dollar quotes.
Note: In simplified wave analysis (SWA), all waves consist of three parts (A, B, and C). The analysis focuses on the last unfinished wave in each time frame. Dotted lines indicate expected movements.
Attention: The wave algorithm does not consider the duration of instrument movements in time.


