


signal strength 2 of 5
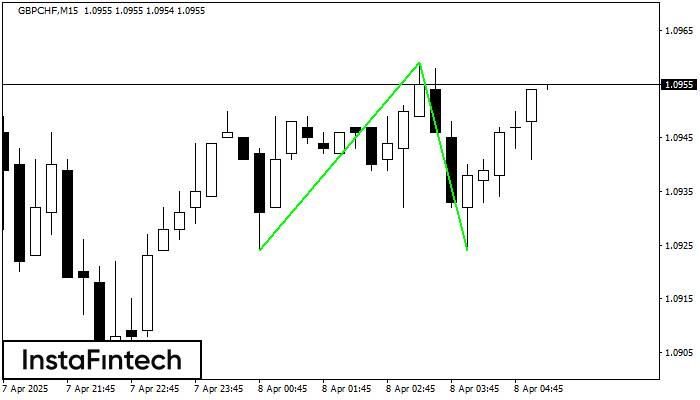
The Double Bottom pattern has been formed on GBPCHF M15. Characteristics: the support level 1.0924; the resistance level 1.0959; the width of the pattern 35 points. If the resistance level is broken, a change in the trend can be predicted with the first target point lying at the distance of 35 points.
The M5 and M15 time frames may have more false entry points.
یہ بھی دیکھیں
- All
- Double Top
- Flag
- Head and Shoulders
- Pennant
- Rectangle
- Triangle
- Triple top
- All
- #AAPL
- #AMZN
- #Bitcoin
- #EBAY
- #FB
- #GOOG
- #INTC
- #KO
- #MA
- #MCD
- #MSFT
- #NTDOY
- #PEP
- #TSLA
- #TWTR
- AUDCAD
- AUDCHF
- AUDJPY
- AUDUSD
- EURCAD
- EURCHF
- EURGBP
- EURJPY
- EURNZD
- EURRUB
- EURUSD
- GBPAUD
- GBPCHF
- GBPJPY
- GBPUSD
- GOLD
- NZDCAD
- NZDCHF
- NZDJPY
- NZDUSD
- SILVER
- USDCAD
- USDCHF
- USDJPY
- USDRUB
- All
- M5
- M15
- M30
- H1
- D1
- All
- Buy
- Sale
- All
- 1
- 2
- 3
- 4
- 5
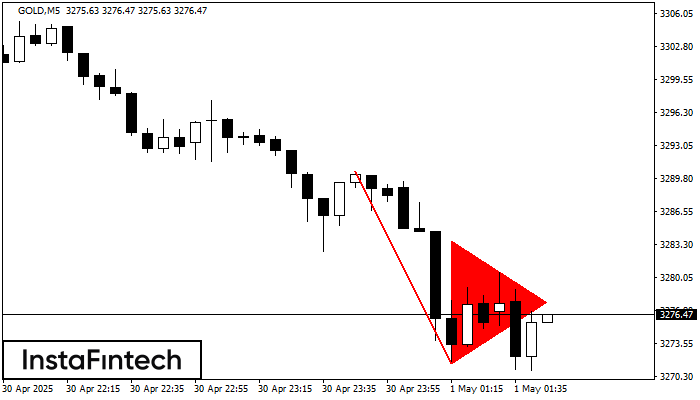
The Bearish pennant pattern has formed on the GOLD M5 chart. It signals potential continuation of the existing trend. Specifications: the pattern’s bottom has the coordinate of 3271.62; the projection
The M5 and M15 time frames may have more false entry points.
Open chart in a new window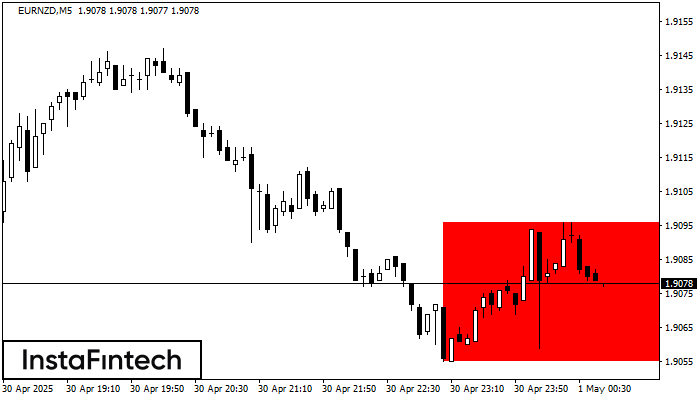
According to the chart of M5, EURNZD formed the Bearish Rectangle. This type of a pattern indicates a trend continuation. It consists of two levels: resistance 1.9096 - 0.0000
The M5 and M15 time frames may have more false entry points.
Open chart in a new window
On the chart of NZDCAD D1 the Double Top reversal pattern has been formed. Characteristics: the upper boundary 0.8316; the lower boundary 0.7826; the width of the pattern 490 points
Open chart in a new window


