


signal strength 4 of 5
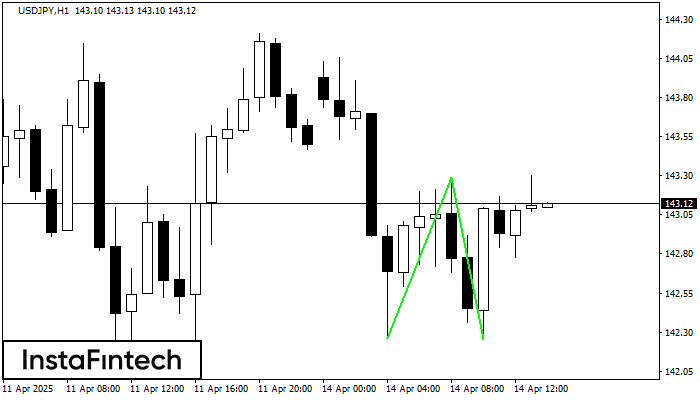
The Double Bottom pattern has been formed on USDJPY H1. Characteristics: the support level 142.26; the resistance level 143.29; the width of the pattern 103 points. If the resistance level is broken, a change in the trend can be predicted with the first target point lying at the distance of 104 points.
See Also
- All
- Double Top
- Flag
- Head and Shoulders
- Pennant
- Rectangle
- Triangle
- Triple top
- All
- #AAPL
- #AMZN
- #Bitcoin
- #EBAY
- #FB
- #GOOG
- #INTC
- #KO
- #MA
- #MCD
- #MSFT
- #NTDOY
- #PEP
- #TSLA
- #TWTR
- AUDCAD
- AUDCHF
- AUDJPY
- AUDUSD
- EURCAD
- EURCHF
- EURGBP
- EURJPY
- EURNZD
- EURRUB
- EURUSD
- GBPAUD
- GBPCHF
- GBPJPY
- GBPUSD
- GOLD
- NZDCAD
- NZDCHF
- NZDJPY
- NZDUSD
- SILVER
- USDCAD
- USDCHF
- USDJPY
- USDRUB
- All
- M5
- M15
- M30
- H1
- D1
- All
- Buy
- Sale
- All
- 1
- 2
- 3
- 4
- 5
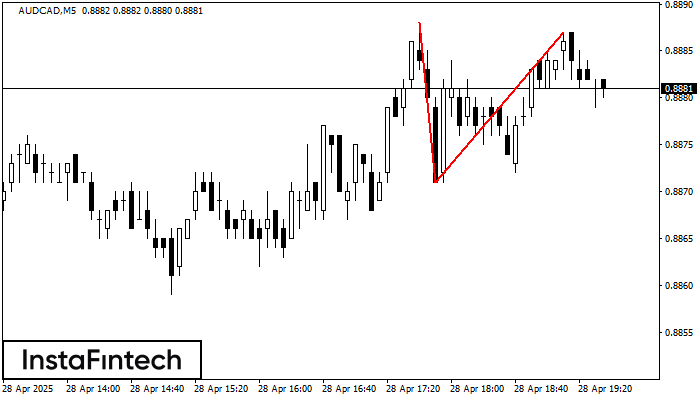
The Double Top reversal pattern has been formed on AUDCAD M5. Characteristics: the upper boundary 0.8888; the lower boundary 0.8871; the width of the pattern is 16 points. Sell trades
The M5 and M15 time frames may have more false entry points.
Open chart in a new window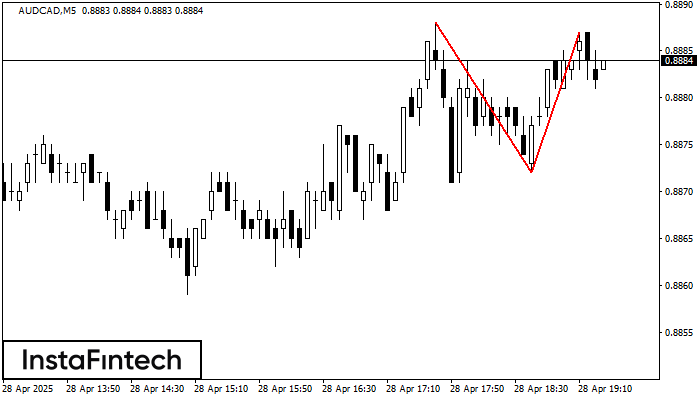
The Double Top pattern has been formed on AUDCAD M5. It signals that the trend has been changed from upwards to downwards. Probably, if the base of the pattern 0.8872
The M5 and M15 time frames may have more false entry points.
Open chart in a new window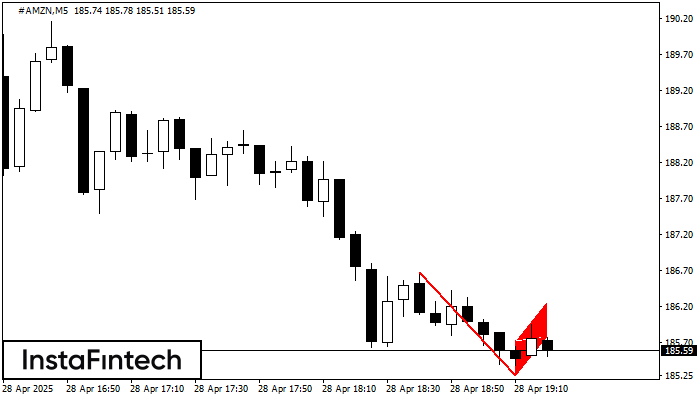
The Bearish Flag pattern has been formed on the chart #AMZN M5 which signals that the downward trend will continue. If the price breaks below the low at 185.25, then
The M5 and M15 time frames may have more false entry points.
Open chart in a new window


