


वास्तविक पैटर्न
पैटर्न ग्राफिकल मॉडल हैं जो चार्ट में मूल्य से बने होते हैं। तकनीकी विश्लेषण भविष्यवाणियों में से एक के अनुसार, इतिहास का मतलब मूल्य आंदोलन खुद को दोहराता है। इसका मतलब है कि मूल्य आंदोलन अक्सर एक ही परिस्थितियों में समान होते हैं जो उच्च संभावना के साथ स्थिति के आगे के विकास की भविष्यवाणी करना संभव बनाता है।
Actual Patterns
- All
- Double Top
- Flag
- Head and Shoulders
- Pennant
- Rectangle
- Triangle
- Triple top
- All
- #AAPL
- #AMZN
- #Bitcoin
- #EBAY
- #FB
- #GOOG
- #INTC
- #KO
- #MA
- #MCD
- #MSFT
- #NTDOY
- #PEP
- #TSLA
- #TWTR
- AUDCAD
- AUDCHF
- AUDJPY
- AUDUSD
- EURCAD
- EURCHF
- EURGBP
- EURJPY
- EURNZD
- EURRUB
- EURUSD
- GBPAUD
- GBPCHF
- GBPJPY
- GBPUSD
- GOLD
- NZDCAD
- NZDCHF
- NZDJPY
- NZDUSD
- SILVER
- USDCAD
- USDCHF
- USDJPY
- USDRUB
- All
- M5
- M15
- M30
- H1
- D1
- All
- Buy
- Sale
- All
- 1
- 2
- 3
- 4
- 5

M5 के चार्ट के अनुसार, GOLD से बियरिश आयत बना जो प्रवृत्ति निरंतरता का पैटर्न है। पैटर्न निम्न सीमाओं के भीतर समाहित है: निचली सीमा 3312.24 – 3312.24 और ऊपरी
M5 और M15 समय सीमा में अधिक फाल्स एंट्री पॉइंट्स हो सकते हैं।
Open chart in a new window
डबल बॉटम पैटर्न NZDCAD M30 पर बना है। विशेषताएं: समर्थन स्तर 0.8188; प्रतिरोध स्तर 0.8232; पैटर्न की चौड़ाई 44 पॉइंट्स। यदि प्रतिरोध स्तर टूट जाता है, तो रुझान में बदलाव
Open chart in a new window
बुलिश फ्लैग पैटर्न NZDCHF पर M5 पर बना है। पैटर्न की निचली सीमा 0.4839/0.4829 पर स्थित है, जबकि उच्च सीमा 0.4849/0.4839 पर स्थित है। फ्लैगपोल का प्रक्षेपण 26 पॉइंट्स
M5 और M15 समय सीमा में अधिक फाल्स एंट्री पॉइंट्स हो सकते हैं।
Open chart in a new window
बुलिश पताका सिग्नल - ट्रेडिंग इंस्ट्रूमेंट NZDCHF M5, निरंतरता पैटर्न। पूर्वानुमान: पैटर्न के उच्च 0.4849 के ऊपर एक खरीद स्थिति सेट करना संभव है, इसके साथ अगला कदम फ्लैगपोल ऊंचाई
M5 और M15 समय सीमा में अधिक फाल्स एंट्री पॉइंट्स हो सकते हैं।
Open chart in a new window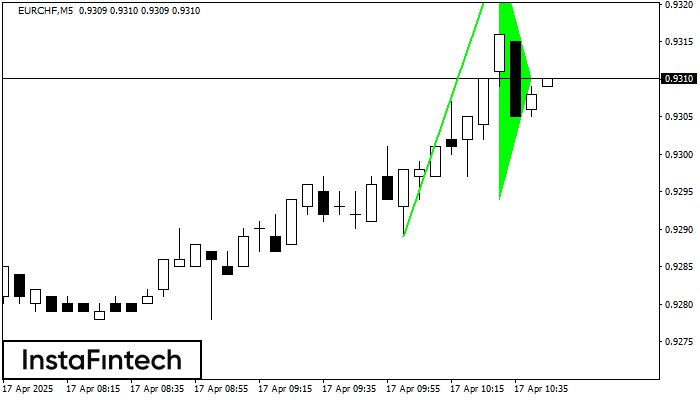
बुलिश पताका पैटर्न EURCHF M5 चार्ट पर बनता है। यह एक प्रकार का निरंतरता पैटर्न है। अगर कीमत पेनेन्ट के उच्च स्तर 0.9326 से ऊपर फिक्स होती है तो
M5 और M15 समय सीमा में अधिक फाल्स एंट्री पॉइंट्स हो सकते हैं।
Open chart in a new window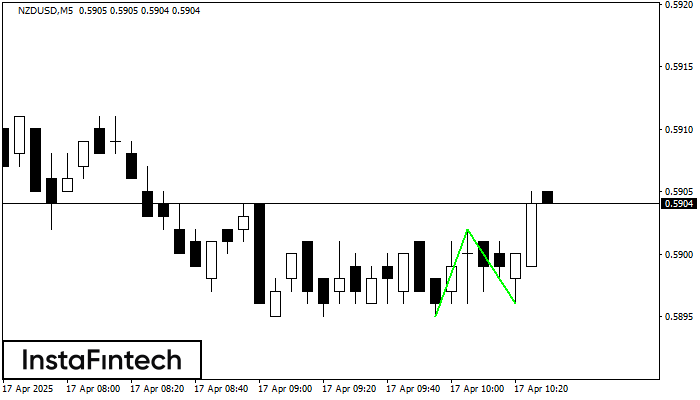
डबल बॉटम पैटर्न NZDUSD M5 पर बना है; ऊपरी सीमा 0.5902 है; निचली सीमा 0.5896 है। पैटर्न की चौड़ाई 7 अंक है। ऊपरी सीमा 0.5902 के टूटने के मामले में
M5 और M15 समय सीमा में अधिक फाल्स एंट्री पॉइंट्स हो सकते हैं।
Open chart in a new window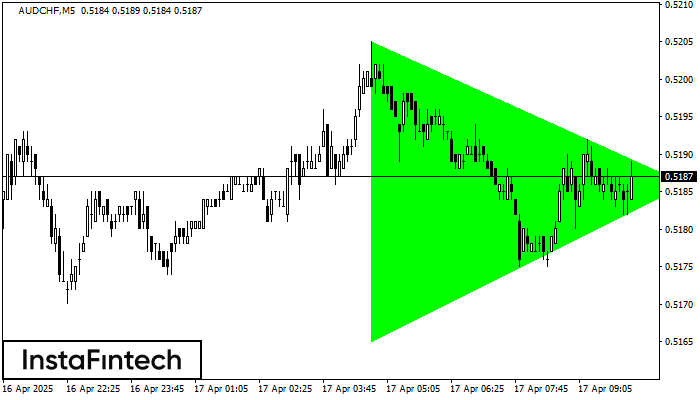
M5 के चार्ट के अनुसार, AUDCHF से बुलिश सिमेट्रिकल त्रिभुज पैटर्न बना। पैटर्न की निचली सीमा ने निर्देशांक 0.5165/0.5186 को स्पर्श किया जबकि ऊपरी सीमा 0.5205/0.5186 के पार गई। यदि
M5 और M15 समय सीमा में अधिक फाल्स एंट्री पॉइंट्स हो सकते हैं।
Open chart in a new window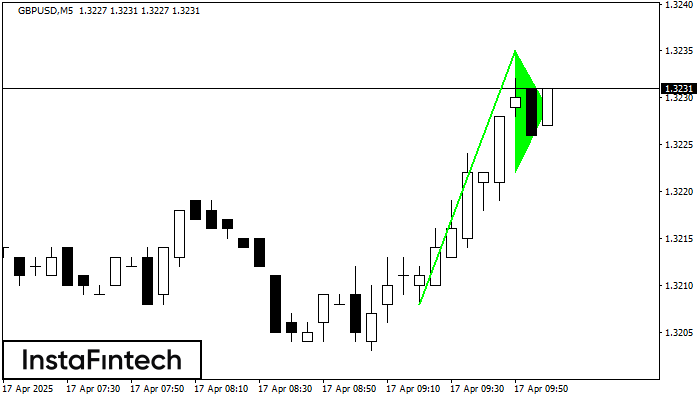
बुलिश पताका ग्राफ़िक पैटर्न GBPUSD M5 इंस्ट्रूमेंट पर बना है। यह निरंतरता पैटर्न की श्रेणी में आता है। इस मामले में, यदि भाव उच्च स्तर पर टूटता है, तो इसके
M5 और M15 समय सीमा में अधिक फाल्स एंट्री पॉइंट्स हो सकते हैं।
Open chart in a new window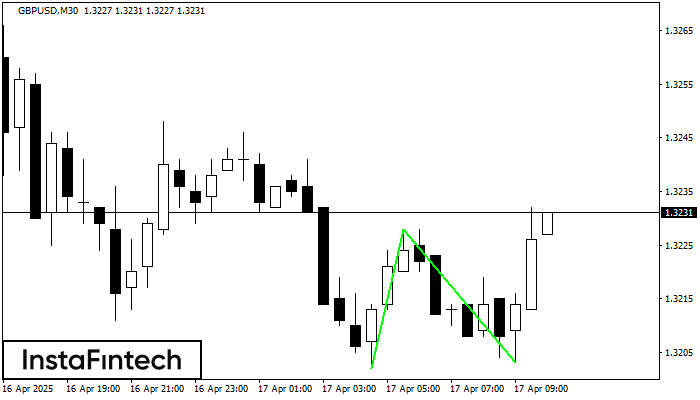
डबल बॉटम पैटर्न GBPUSD M30 पर बना है; ऊपरी सीमा 1.3228 है; निचली सीमा 1.3203 है। पैटर्न की चौड़ाई 26 अंक है। ऊपरी सीमा 1.3228 के टूटने के मामले में
Open chart in a new window


