empty
15.11.2021 07:05 AM
Buying and selling on stock market on November 15

Buying Baidu's stock is hedged by selling Comcast.

Buying Baidu's stock(#BIDU). Chinese Internet service, search engine.

This image is no longer relevant

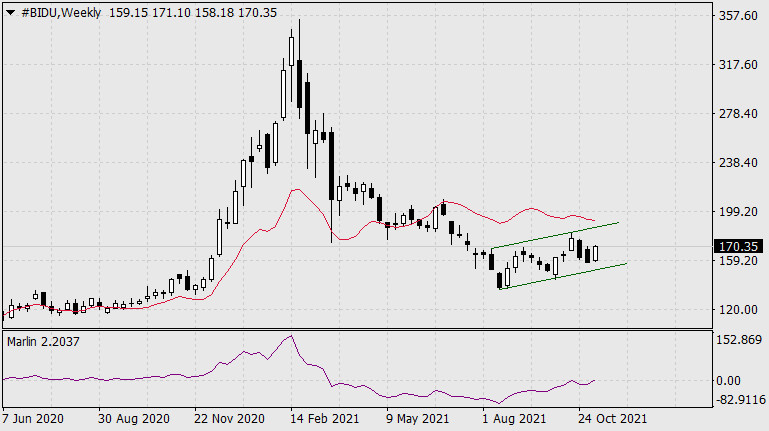
On the weekly chart, the signal line of the Marlin oscillator has overcome the boundary of the bulls' territory. The price is developing in the local rising price channel. Price growth to its upper boundary is likely with the probable exit from it. Let's discuss the details on a daily chart.

This image is no longer relevant

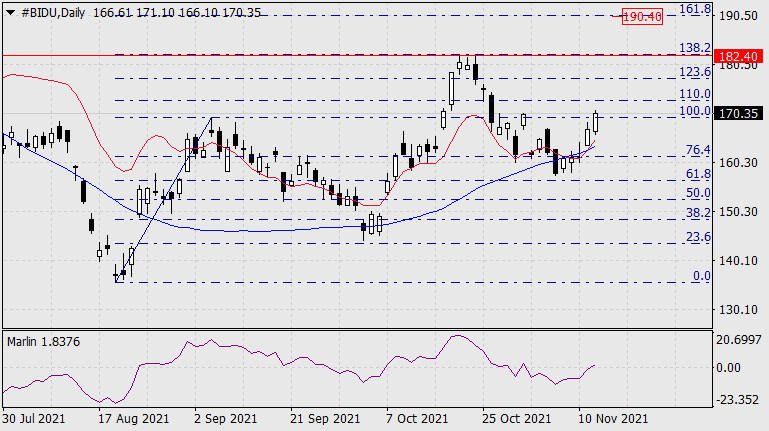
On the daily chart, the price has consolidated above the balance and Kruzenshtern indicator lines, the Marlin oscillator has entered the zone of positive values, i.e. the price moves into the area of predominant growth. The first movement target is the 138.2% Fibonacci level at 182.40. Besides, it is also a resistance level on October 20-22 and support on June 16-21. The second target is the 161.8% Fibonacci level at 190.40.

Selling Comcast Corporation's stock(#CMCSA). US telecommunications corporation.

This image is no longer relevant

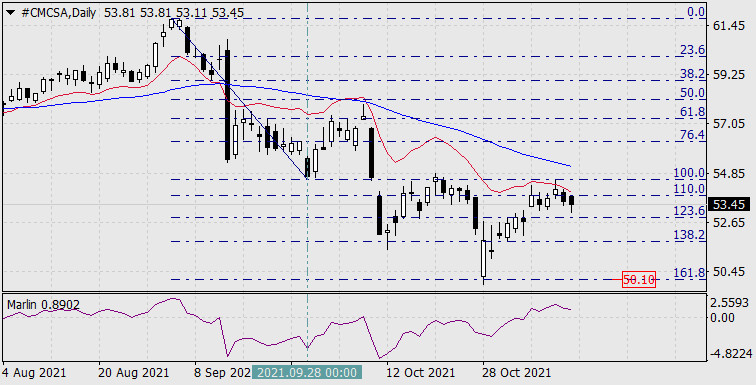
On the daily chart, it is possible to observe that on the third bar the price reversed from the 100.0% Fibonacci level, the low of September 28 and resistance of October 20-21. At the same time, the price did not cross over the red indicator balance line. This fact indicates that the price growth occurred within the correction. The trend is descending and now the price is reversing to the direction of its new wave. The Marlin oscillator is turning downward. The nearest movement target is the 161.8% Fibonacci level at the price of 50.10.

Laurie Bailey,
Analytical expert of InstaForex
© 2007-2025
Select timeframe
5
min
15
min
30
min
1
hour
4
hours
1
day
1
week
Earn on cryptocurrency rate changes with InstaForex
Download MetaTrader 4 and open your first trade
  • Grand Choice
    Contest by
    InstaForex
    InstaForex always strives to help you
    fulfill your biggest dreams.
    JOIN CONTEST

Recommended Stories

US market: GDP shrinks, but Wall Street climbs

S&P 500 Overview for May 1 GDP contracts, but US market climbs Key US indices on Friday: Dow +0.4%, NASDAQ -0.1%, S&P 500 +0.2%, S&P 500: 5,560, trading range: 5,150–5,800

Jozef Kovach 12:19 2025-05-01 UTC+2

Stock Market for April 30th: S&P 500 and NASDAQ Continue Clinging to Any Positive News

At the close of the previous regular session, U.S. stock indices finished in positive territory. The S&P 500 rose by 0.58%, and the Nasdaq 100 gained 0.55%. The Dow Jones

Jakub Novak 11:10 2025-04-30 UTC+2

The Stock Market Rally Should Not Be Misleading

The wave pattern on the 24-hour chart of the #SPX looks generally clear. The global five-wave structure doesn't even fit into the terminal window at its smallest scale. In simple

Chin Zhao 11:17 2025-04-29 UTC+2

Stock Market for April 29th: S&P 500 and NASDAQ Still Have Growth Potential

At the close of the previous regular session, U.S. stock indices ended mixed. The S&P 500 rose by 0.06%, while the Nasdaq 100 fell by 0.10%. The Dow Jones Industrial

Jakub Novak 10:59 2025-04-29 UTC+2

Stock Market Update for April 28th: S&P 500 and NASDAQ Pause Their Advance

In the previous regular session, U.S. stock indices closed higher. The S&P 500 gained 0.74%, the Nasdaq 100 rose 1.26%, and the Dow Jones Industrial Average edged up by 0.05%

Jakub Novak 09:06 2025-04-28 UTC+2

Stock Market on April 25th: S&P 500 and NASDAQ Resume Growth

At the close of the last regular session, U.S. stock indices ended higher. The S&P 500 rose by 2.03%, while the Nasdaq 100 gained 2.74%. The Dow Jones Industrial Average

Jakub Novak 11:27 2025-04-25 UTC+2

US Stock Market on April 24: S&P 500 and NASDAQ lose momentum after rally

Following the previous regular session, US stock indices closed higher. The S&P 500 gained 1.67%, the Nasdaq 100 rose by 2.50%, and the Dow Jones Industrial Average increased by 1.07%

Jakub Novak 11:41 2025-04-24 UTC+2

Trump Eases Pressure on China

The wave pattern on the 24-hour chart for #SPX is generally clear. The global five-wave structure doesn't even fit on the terminal screen at the smallest scale. In simple terms

Chin Zhao 10:34 2025-04-24 UTC+2

Stock market review for April 22: S&P 500 and Nasdaq extend losses

The US stock market closed lower in the most recent regular session. The S&P 500 fell by 2.36%, while the Nasdaq 100 lost 2.45%. The Dow Jones Industrial Average dropped

Jakub Novak 11:26 2025-04-22 UTC+2

Stock Market Update for April 21st: S&P 500 and NASDAQ Resume Decline Amid New Rumors

At the close of the previous regular session, U.S. stock indices ended mixed. The S&P 500 gained 0.13%, while the Nasdaq 100 slipped 0.13%. The industrial Dow Jones dropped 1.33%

Jakub Novak 11:57 2025-04-21 UTC+2
Can't speak right now?
Ask your question in the chat.
Widget callback
 

Dear visitor,

Your IP address shows that you are currently located in the USA. If you are a resident of the United States, you are prohibited from using the services of InstaFintech Group including online trading, online transfers, deposit/withdrawal of funds, etc.

If you think you are seeing this message by mistake and your location is not the US, kindly proceed to the website. Otherwise, you must leave the website in order to comply with government restrictions.

Why does your IP address show your location as the USA?

  • - you are using a VPN provided by a hosting company based in the United States;
  • - your IP does not have proper WHOIS records;
  • - an error occurred in the WHOIS geolocation database.

Please confirm whether you are a US resident or not by clicking the relevant button below. If you choose the wrong option, being a US resident, you will not be able to open an account with InstaForex anyway.

We are sorry for any inconvenience caused by this message.