


Actual patterns
Patterns are graphical models which are formed in the chart by the price. According to one of the technical analysis postulates, history (price movement) repeats itself. It means that the price movements are often similar in the same situations which makes it possible to predict the further development of the situation with a high probability.
Actual Patterns
- All
- Double Top
- Flag
- Head and Shoulders
- Pennant
- Rectangle
- Triangle
- Triple top
- All
- #AAPL
- #AMZN
- #Bitcoin
- #EBAY
- #FB
- #GOOG
- #INTC
- #KO
- #MA
- #MCD
- #MSFT
- #NTDOY
- #PEP
- #TSLA
- #TWTR
- AUDCAD
- AUDCHF
- AUDJPY
- AUDUSD
- EURCAD
- EURCHF
- EURGBP
- EURJPY
- EURNZD
- EURRUB
- EURUSD
- GBPAUD
- GBPCHF
- GBPJPY
- GBPUSD
- GOLD
- NZDCAD
- NZDCHF
- NZDJPY
- NZDUSD
- SILVER
- USDCAD
- USDCHF
- USDJPY
- USDRUB
- All
- M5
- M15
- M30
- H1
- D1
- All
- Buy
- Sale
- All
- 1
- 2
- 3
- 4
- 5

The Triple Bottom pattern has formed on the chart of the GBPAUD M5 trading instrument. The pattern signals a change in the trend from downwards to upwards in the case
The M5 and M15 time frames may have more false entry points.
Open chart in a new window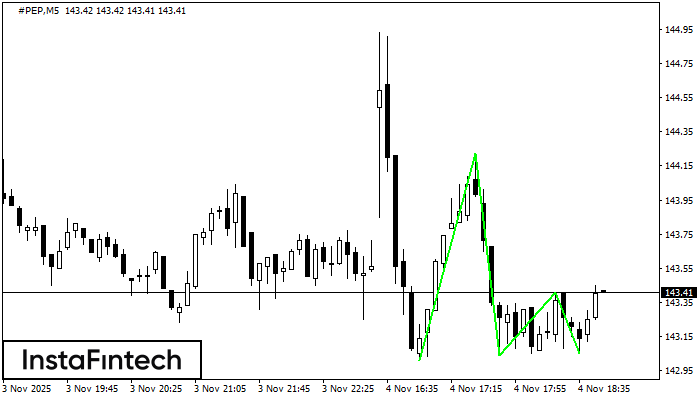
The Triple Bottom pattern has been formed on #PEP M5. It has the following characteristics: resistance level 144.22/143.41; support level 143.01/143.05; the width is 121 points. In the event
The M5 and M15 time frames may have more false entry points.
Open chart in a new window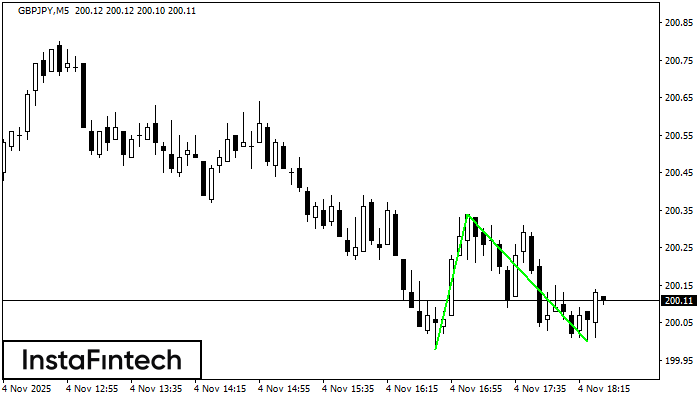
The Double Bottom pattern has been formed on GBPJPY M5; the upper boundary is 200.34; the lower boundary is 200.00. The width of the pattern is 36 points. In case
The M5 and M15 time frames may have more false entry points.
Open chart in a new window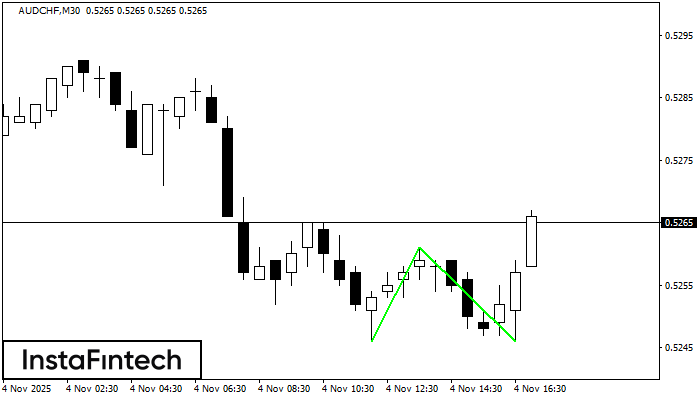
The Double Bottom pattern has been formed on AUDCHF M30. Characteristics: the support level 0.5246; the resistance level 0.5261; the width of the pattern 15 points. If the resistance level
Open chart in a new window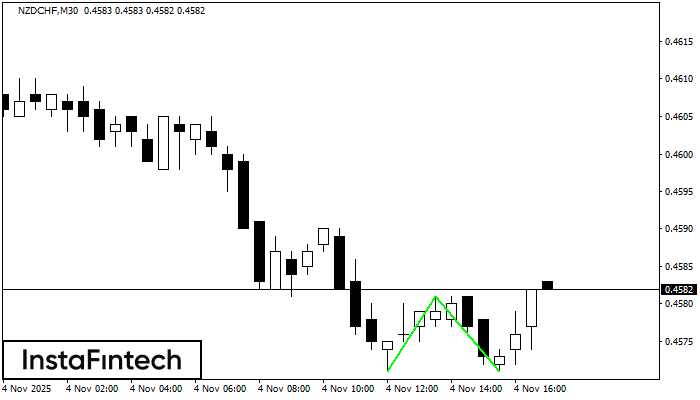
The Double Bottom pattern has been formed on NZDCHF M30. Characteristics: the support level 0.4571; the resistance level 0.4581; the width of the pattern 10 points. If the resistance level
Open chart in a new window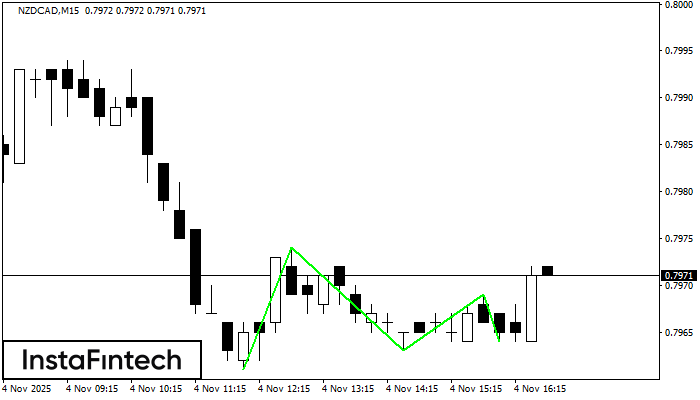
The Triple Bottom pattern has formed on the chart of NZDCAD M15. Features of the pattern: The lower line of the pattern has coordinates 0.7974 with the upper limit 0.7974/0.7969
The M5 and M15 time frames may have more false entry points.
Open chart in a new window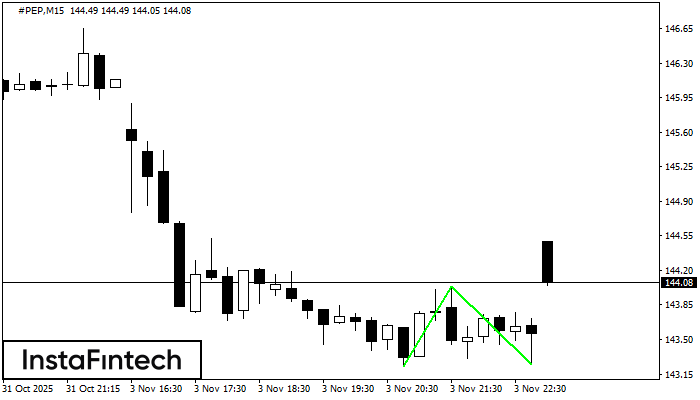
The Double Bottom pattern has been formed on #PEP M15. Characteristics: the support level 143.23; the resistance level 144.04; the width of the pattern 81 points. If the resistance level
The M5 and M15 time frames may have more false entry points.
Open chart in a new window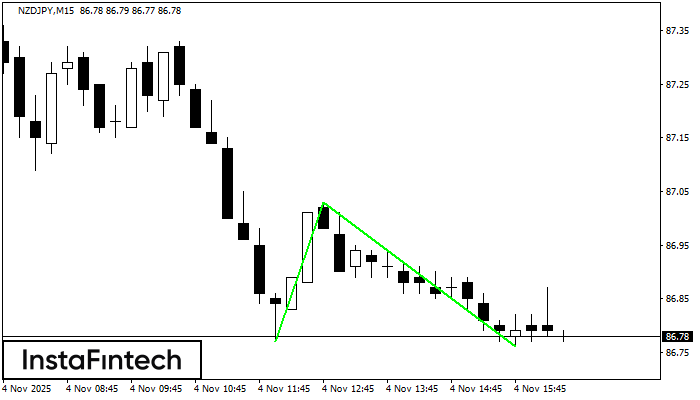
The Double Bottom pattern has been formed on NZDJPY M15; the upper boundary is 87.03; the lower boundary is 86.76. The width of the pattern is 26 points. In case
The M5 and M15 time frames may have more false entry points.
Open chart in a new window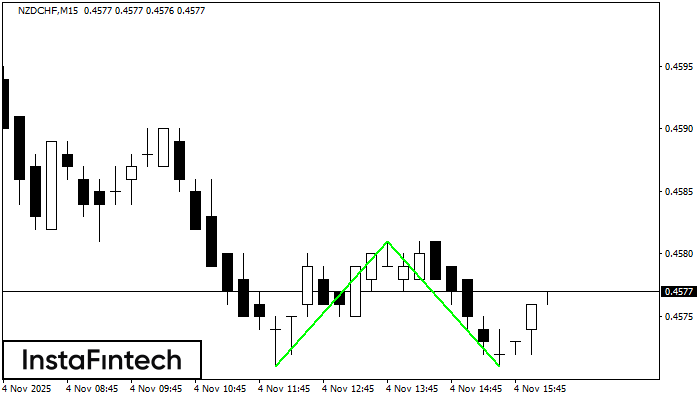
The Double Bottom pattern has been formed on NZDCHF M15; the upper boundary is 0.4581; the lower boundary is 0.4571. The width of the pattern is 10 points. In case
The M5 and M15 time frames may have more false entry points.
Open chart in a new window


