empty
04.02.2025 05:16 PM
GBP/USD: Trading Plan for the U.S. Session on February 4th (Analysis of Morning Trades)

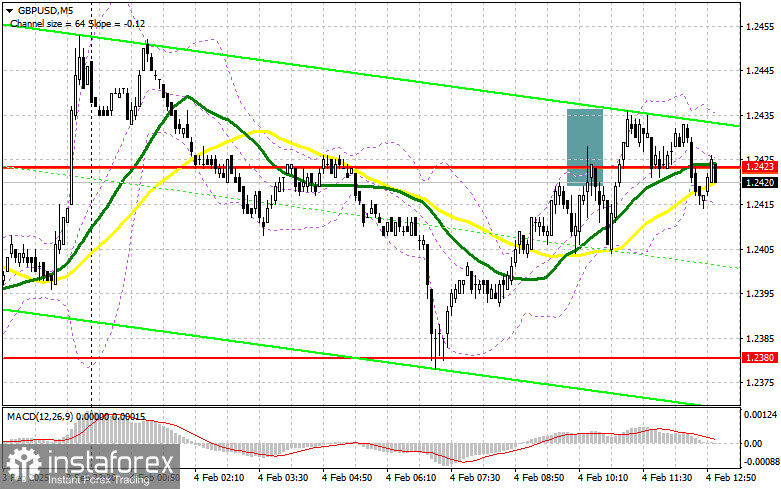
In my morning forecast, I focused on the 1.2423 level and planned to make trading decisions around it. Let's examine the 5-minute chart to understand what happened. The pair rose and formed a false breakout, leading to short positions being opened. However, after a 15-point decline, demand for the pound returned, and trading shifted back to the 1.2420 level. The technical outlook has been revised for the second half of the day.

This image is no longer relevant

To Open Long Positions on GBP/USD:

The fact that pound buyers are performing better than sellers today indicates a good chance for GBP/USD to continue its upward movement and test monthly highs. Weak data on job openings and factory orders from the U.S. Bureau of Labor Statistics could support this movement. Speeches from FOMC members Raphael Bostic and Mary Daly will also be in focus.

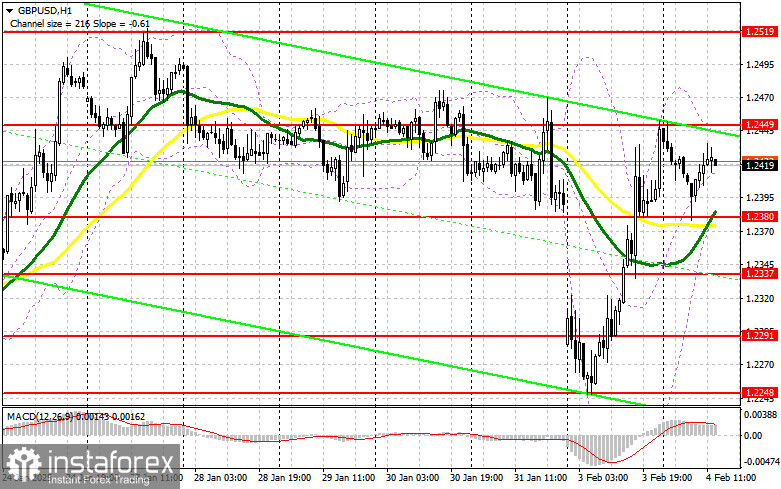
If the pair declines—as was expected earlier today—I'll only open long positions after a false breakout near the new support at 1.2380, aiming for a rise towards 1.2449, which hasn't been tested yet. A break and retest of this range from above will signal a new entry point for long positions, targeting a breakout to 1.2519, which would establish a new bullish market. The ultimate target will be the 1.2571 level, where I plan to lock in profits.

If GBP/USD falls and there's no bullish activity around 1.2380, pressure on the pound will increase. In that case, only a false breakout around the 1.2337 low will provide a buying opportunity. I'll open long positions on a rebound from 1.2291, targeting a 30-35 point intraday correction.

To Open Short Positions on GBP/USD:

Pound sellers made attempts but have not achieved significant results. Perhaps strong U.S. data and the threat of tariffs from Trump later today will renew pressure on the pound. If bears want to regain control of the market, they must act near the nearest resistance at 1.2449. A false breakout there will provide an entry point for short positions targeting a decline to 1.2380, where the moving averages—currently favoring bulls—are located. A break and retest of this range from below will trigger stop-loss orders, opening the path to 1.2337. The ultimate target will be 1.2291, where I'll take profits.

If demand for the pound persists in the second half of the day and bears fail to act near 1.2449, the bullish market will continue. In that case, I will delay selling until testing the 1.2519 resistance. I will only open short positions after a failed breakout there. If there's no downward movement, I'll look for short opportunities on a rebound from 1.2571, targeting a 30-35 point downward correction.

This image is no longer relevant

COT Report (Commitment of Traders) - January 28:

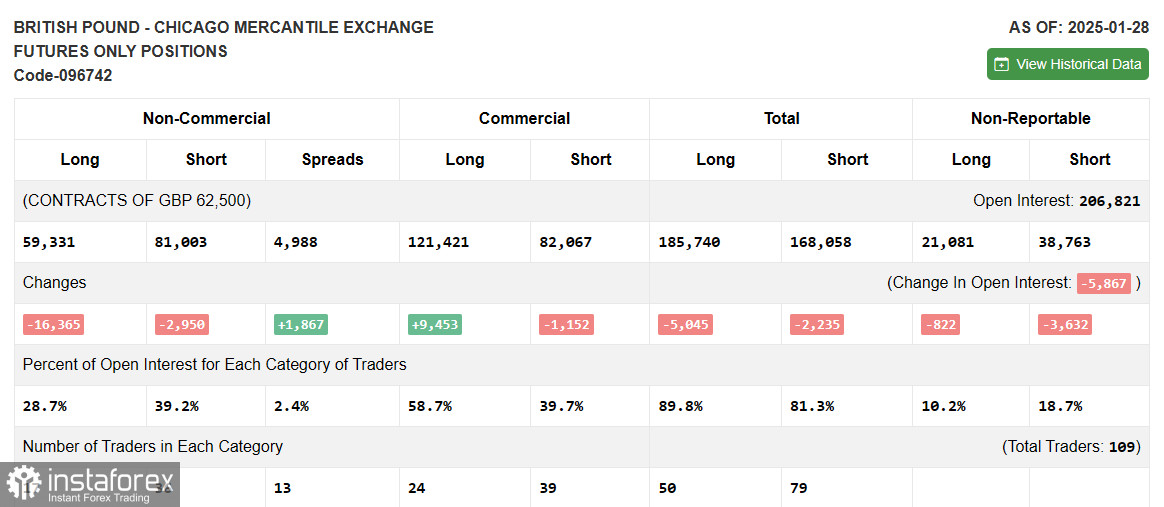
The January 28 COT report showed a reduction in both short and long positions. The balance of power continues to shift towards sellers, which is unsurprising. UK economic data points to rising inflation, while the economy is contracting, leaving the Bank of England with limited options. It's likely that interest rates will be cut at the next meeting, which will negatively impact the pound's future growth prospects.

The COT report indicates that long non-commercial positions fell by 16,365 to 59,331, while short non-commercial positions decreased by 2,950 to 81,003. As a result, the gap between long and short positions increased by 1,867.

This image is no longer relevant

Indicator Signals

Moving AveragesTrading is taking place above the 30- and 50-period moving averages, indicating further growth for the pound.Note: The moving average periods and prices are based on the H1 hourly chart and may differ from the standard daily moving averages on the D1 chart.

Bollinger BandsIn case of a decline, the lower boundary of the indicator near 1.2380 will act as support.

Indicator Descriptions:

  • Moving Average (MA): Determines the current trend by smoothing out volatility and noise.
    • 50-period MA marked in yellow on the chart.
    • 30-period MA marked in green on the chart.
  • MACD (Moving Average Convergence/Divergence):
    • Fast EMA – 12-period
    • Slow EMA – 26-period
    • SMA – 9-period
  • Bollinger Bands: Measures volatility and identifies overbought/oversold conditions.
    • 20-period
  • Non-Commercial Traders: Speculators such as individual traders, hedge funds, and large institutions using the futures market for speculative purposes.
  • Long Non-Commercial Positions: Total open long positions held by non-commercial traders.
  • Short Non-Commercial Positions: Total open short positions held by non-commercial traders.
  • Net Non-Commercial Position: The difference between non-commercial short and long positions.
Miroslaw Bawulski,
Analytical expert of InstaForex
© 2007-2025
GBPUSD
Great Britain Pound vs US Dollar
Summary
Sell
Urgency
1 day
Analytic
Maxim Magdalinin
Start trade
Earn on cryptocurrency rate changes with InstaForex
Download MetaTrader 4 and open your first trade
  • Grand Choice
    Contest by
    InstaForex
    InstaForex always strives to help you
    fulfill your biggest dreams.
    JOIN CONTEST

Recommended Stories

GBP/USD: Trading Plan for the U.S. Session on March 14th (Review of Morning Trades)

In my morning forecast, I focused on the 1.2949 level and planned to base my trading decisions on it. Let's examine the 5-minute chart to see what happened. A rise

Miroslaw Bawulski 15:25 2025-03-14 UTC+2

EUR/USD: Trading Plan for the U.S. Session on March 14th (Review of Morning Trades)

In my morning forecast, I focused on the 1.0852 level and planned to base my trading decisions on it. Let's examine the 5-minute chart to see what happened. A rise

Miroslaw Bawulski 15:00 2025-03-14 UTC+2

How to Trade the GBP/USD Pair on March 14? Simple Tips and Trade Analysis for Beginners

Analysis of Thursday's Trades 1H Chart of GBP/USD On Thursday, the GBP/USD pair experienced a slight decline but remained within a very narrow range, resembling a sideways channel. The British

Paolo Greco 06:07 2025-03-14 UTC+2

How to Trade the EUR/USD Pair on March 14? Simple Tips and Trade Analysis for Beginners

Analysis of Thursday's Trades 1H Chart of EUR/USD On Thursday, the EUR/USD currency pair continued its moderate downward trend after experiencing a rise that lasted a week and a half

Paolo Greco 06:07 2025-03-14 UTC+2

Trading Recommendations and Analysis for GBP/USD on March 14: The Pound Sterling Isn't Even Trying

The GBP/USD currency pair experienced a slight pullback on Thursday but did not manage to consolidate below the critical line. The Kijun-sen line is situated very close to the current

Paolo Greco 02:38 2025-03-14 UTC+2

Trading Recommendations and Analysis for EUR/USD on March 14: The Euro Pretends to Correct

The EUR/USD currency pair experienced very weak volatility on Thursday, with only a slight correction. Over the past few weeks, the euro has gained 600 pips, and this entire upward

Paolo Greco 02:38 2025-03-14 UTC+2

GBP/USD: Trading Plan for the U.S. Session on March 13th (Review of Morning Trades)

In my morning forecast, I focused on the 1.2949 level and planned to make trading decisions based on it. Let's look at the 5-minute chart and analyze what happened

Miroslaw Bawulski 18:26 2025-03-13 UTC+2

EUR/USD: Trading Plan for the U.S. Session on March 13th (Review of Morning Trades)

In my morning forecast, I focused on the 1.0877 level and planned to make trading decisions based on it. Let's look at the 5-minute chart and analyze what happened

Miroslaw Bawulski 18:22 2025-03-13 UTC+2

How to Trade the GBP/USD Pair on March 13? Simple Tips and Trade Analysis for Beginners

Analysis of Wednesday's Trades 1H Chart of GBP/USD On Wednesday, the GBP/USD pair continued its upward movement. The U.S. inflation report should have caused at least a slight drop

Paolo Greco 06:12 2025-03-13 UTC+2

How to Trade the EUR/USD Pair on March 13? Simple Tips and Trade Analysis for Beginners

Analysis of Wednesday's Trades 1H Chart of EUR/USD On Wednesday, the EUR/USD currency pair failed to establish new grounds for its upward movement. This is not surprising, as the market

Paolo Greco 06:12 2025-03-13 UTC+2
Can't speak right now?
Ask your question in the chat.
Widget callback
 

Dear visitor,

Your IP address shows that you are currently located in the USA. If you are a resident of the United States, you are prohibited from using the services of InstaFintech Group including online trading, online transfers, deposit/withdrawal of funds, etc.

If you think you are seeing this message by mistake and your location is not the US, kindly proceed to the website. Otherwise, you must leave the website in order to comply with government restrictions.

Why does your IP address show your location as the USA?

  • - you are using a VPN provided by a hosting company based in the United States;
  • - your IP does not have proper WHOIS records;
  • - an error occurred in the WHOIS geolocation database.

Please confirm whether you are a US resident or not by clicking the relevant button below. If you choose the wrong option, being a US resident, you will not be able to open an account with InstaForex anyway.

We are sorry for any inconvenience caused by this message.