empty
 
 
16.10.2024 02:47 PM
GBP/USD. October 16th. Andrew Bailey Confuses Traders

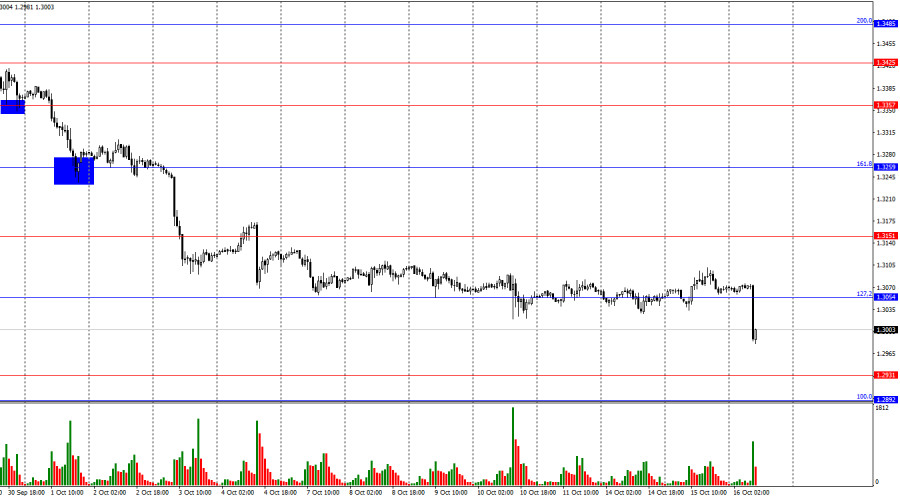
On the hourly chart, the GBP/USD pair traded sideways on Tuesday, but on Wednesday morning, it resumed its decline toward the next support zone of 1.2931–1.2892. There were no technical sell signals, as traders have been ignoring the 1.3054 level for over a week. Today's decline was primarily related to the UK inflation report, and it may continue throughout the day.

This image is no longer relevant

There are no concerns regarding the wave pattern. The last completed upward wave (September 26) did not break the peak of the previous wave, while the downward wave, which has been forming for 14 days, easily broke the low of the previous wave at the 1.3311 level. Thus, the "bullish" trend is now considered over, and the formation of a "bearish" trend has begun. A corrective upward wave can be expected from the 1.2931 level, but signals must form first.

There was little news from the UK and the US on Tuesday, but Wednesday started with a bombshell. The UK Consumer Price Index slowed to 1.7%. Traders had expected a maximum drop to 1.9% year-over-year. The core CPI fell to 3.2% year-over-year, compared to the forecast of 3.4%. Inflation in the UK continues to decline rapidly, enough for the Bank of England to consider resuming monetary easing measures. It is worth noting that a month ago, Bank of England Governor Andrew Bailey stated that he expected inflation to accelerate, and therefore, cutting interest rates would have to be delayed. However, two weeks ago, Bailey mentioned that if inflation continued to fall, the Bank of England was prepared to resume monetary easing. Today, confirmation was received that UK inflation is indeed falling. This implies that the pound may continue to decline, as the market may now anticipate several easing measures from the British regulator.

This image is no longer relevant

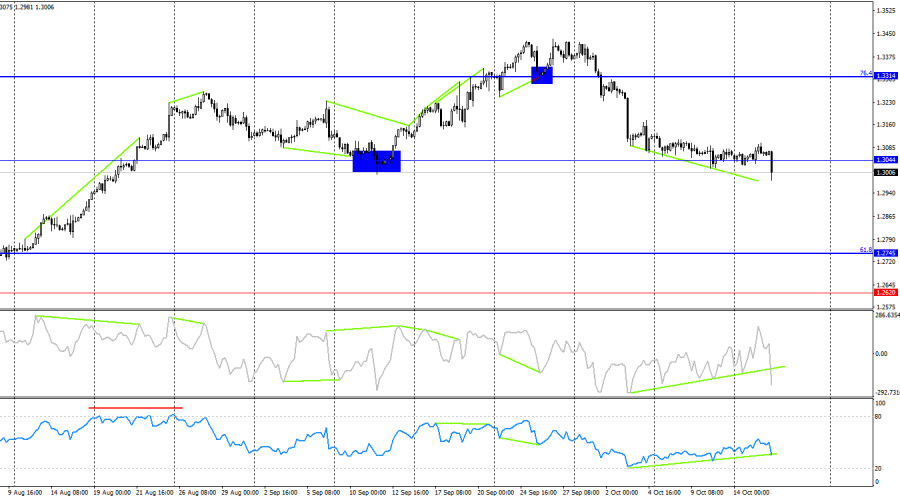
On the 4-hour chart, the pair has dropped to the 1.3044 level, and today it may consolidate below it. A "bullish" divergence has been forming for over a week on both indicators, signaling a possible rebound from the 1.3044 level. However, no rebound has occurred. Consolidation below 1.3044 would suggest further declines toward the 61.8% Fibonacci level at 1.2745, despite the divergences. This would indicate that the bears are ready to continue driving the market downward.

Commitments of Traders (COT) Report:

This image is no longer relevant

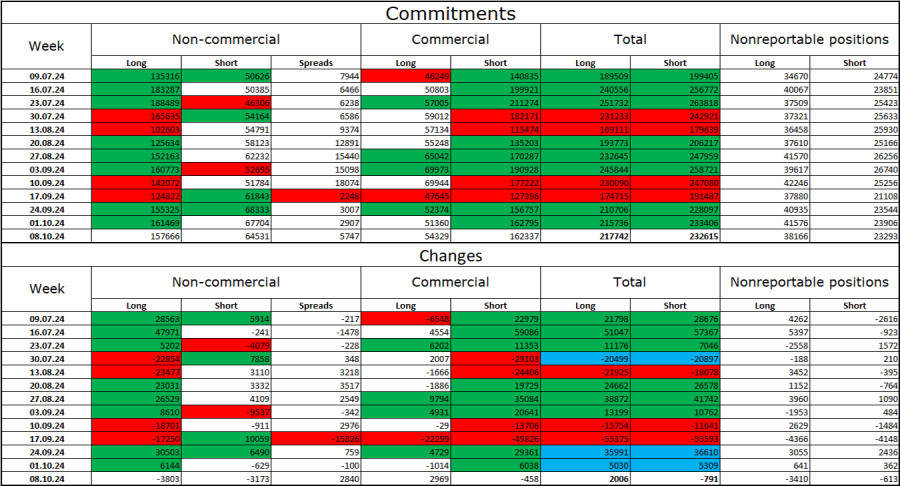
The sentiment of the "Non-commercial" trader category remained unchanged last week and is still "bullish." The number of long positions held by speculators decreased by 3,803, while short positions dropped by 3,173. Over the past two weeks, professional traders were reducing their long positions and increasing short positions, but they have now resumed buying the pound. Bulls maintain a strong advantage, with the gap between long and short positions standing at 93,000: 158,000 versus 65,000.

In my view, the prospects for further declines in the pound remain, even though the COT reports currently suggest otherwise. Over the last three months, the number of long positions has risen from 135,000 to 158,000, while short positions increased from 50,000 to 65,000. I believe that, over time, professional players will either reduce their long positions or increase their shorts, as the key factors supporting pound purchases have already played out. Technical analysis suggests that this process could begin soon.

News Calendar for the US and the UK:

  • UK – Consumer Price Index (06:00 UTC)

On Wednesday, the economic calendar contains only one major event, which has already been released and triggered renewed bearish activity. The influence of this news on market sentiment could remain strong throughout the rest of the day.

GBP/USD Forecast and Trading Tips:

Selling the pair was possible after a rebound from the 1.3425 level on the hourly chart, with targets at 1.3357, 1.3259, 1.3151, and 1.3054. All targets have been hit, and I believe these sell positions can now be closed. New positions can be opened if the pair closes below 1.3044 on the 4-hour chart, targeting 1.2931, but ideally after a correction. Currently, I do not see any potential buy signals.

The Fibonacci grids are built from 1.2892 to 1.2298 on the hourly chart and from 1.4248 to 1.0404 on the 4-hour chart.

Samir Klishi,
Analytical expert of InstaForex
© 2007-2024
Earn on cryptocurrency rate changes with InstaForex
Download MetaTrader 4 and open your first trade
  • Grand Choice
    Contest by
    InstaForex
    InstaForex always strives to help you
    fulfill your biggest dreams.
    JOIN CONTEST
  • Chancy Deposit
    Deposit your account with $3,000 and get $1000 more!
    In October we raffle $1000 within the Chancy Deposit campaign!
    Get a chance to win by depositing $3,000 to a trading account. Having fulfilled this condition, you become a campaign participant.
    JOIN CONTEST
  • Trade Wise, Win Device
    Top up your account with at least $500, sign up for the contest, and get a chance to win mobile devices.
    JOIN CONTEST
  • 100% Bonus
    Your unique opportunity to get a 100% bonus on your deposit
    GET BONUS
  • 55% Bonus
    Apply for a 55% bonus on your every deposit
    GET BONUS
  • 30% Bonus
    Receive a 30% bonus every time you top up your account
    GET BONUS

Recommended Stories

Can't speak right now?
Ask your question in the chat.
Widget callback